Transforming Raw Signals Into Actionable Visual Data for Real-Time Business Dashboards
Invented by Sherman; William, Sherman IP, LLC
This article will help you understand a new patent about how to process and show complex data, especially time-based data like financial prices. We will look at the market needs, the science behind it, and then explain how the invention works. By the end, you’ll have a simple, clear view of why this invention matters.
Background and Market Context
Let’s start with why this invention exists. In today’s world, data comes from everywhere, all the time. Banks, traders, businesses, and even regular people watch numbers that change every second. These changing numbers, called time-series data, can be anything from stock prices to temperature records. But time-series data is messy. It jumps up and down, sometimes for no clear reason. This makes it hard for people to make sense of what’s really happening.
Take the stock market as an example. A company’s share price can change every second. Investors want to know if the price is going up or down, if it’s stable, or if it might crash soon. But just looking at the raw numbers doesn’t help. You need to process the data, find patterns, and then show it in a way that’s easy to understand. The same is true in other fields: weather forecasts, energy usage, even tracking how many people visit a website.
People have tried to solve this problem for years. They use charts, graphs, and dashboards. But these tools often need experts to set up. They may not adjust well when the data becomes extra wild or changes its usual pattern. Sometimes, the rules that work for one set of data don’t work for another.
Also, today’s users want to interact with their data. They want to change settings, pick what they see, and get answers fast. In finance, for instance, one investor may want to see “momentum”—how quickly a stock is moving up or down. Another may want “trends”—the general direction over many days. Some want alerts when certain things happen. The old tools often can’t do all this, or they’re too hard for normal people to use.
That’s where this invention comes in. It’s designed to take in any time-based data, let the user set up their own rules and preferences, process the data using smart math, and then show the answer in a way that’s easy to see and act on. It’s meant for the modern world, where data is fast, users are in control, and quick, clear answers are needed every day.
Scientific Rationale and Prior Art
Now let’s explain the science and what came before. At the heart of the problem is handling “nonstationary” data. This is data that doesn’t have steady patterns. In the real world, most time-series data is nonstationary. That means the average can shift, the ups and downs can get bigger or smaller, and the whole thing can change in ways that are hard to predict.
Traditional methods for looking at patterns in data often assume the data is steady. For example, simple moving averages give you the average of the last few numbers. But if the data suddenly becomes more jumpy, the moving average can become less useful. Other methods, like trend lines, can miss quick changes.
People also use momentum indicators. These try to show if a value is speeding up or slowing down. In finance, tools like the Relative Strength Index (RSI) or the Moving Average Convergence Divergence (MACD) are common. These tools look at how fast prices are rising or falling. But, to use them, you need to pick the right time window, and sometimes they don’t adjust well when the data changes speed.
Another class of tools are autoregressive models. These use the idea that tomorrow’s value depends on what happened today and yesterday. They are good for finding deeper patterns. But they also need careful tuning, and they may not work well if the data’s main features change suddenly.
For showing results, people use dashboards. But often, these are built for one job and don’t let users change the rules easily. If you want to look at the data a different way, you need to build a new dashboard or get an expert to help.
Some tools let you set up “if this, then that” rules. For example, “If the momentum is high and the trend is up, recommend buying.” But these tools usually work for just a few rules and don’t combine different types of filters easily. They also may not give much feedback about how the answer was reached.
Recent years have seen more use of machine learning, where computers learn patterns from lots of data. But even with machine learning, you need clean, processed data and a way for users to interact with the results. Many machine learning solutions are a black box—users can’t see or control how the answer is made.
In summary, previous tools are either too simple for tricky, fast-changing data, too rigid for custom needs, or too hard for normal users to control. There’s a need for something that combines strong data processing, flexible user control, and clear, interactive displays.
Invention Description and Key Innovations
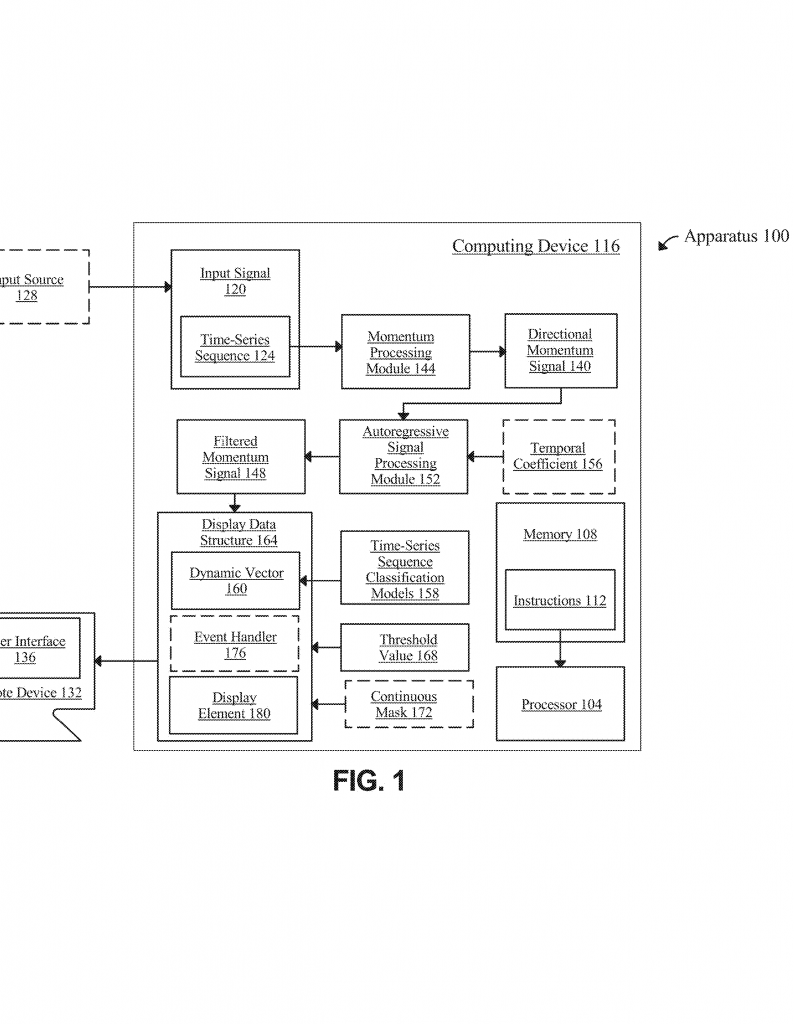
This invention is a smart system for taking in time-series data, letting the user set up their own rules, processing the data with advanced methods, and then building a “display data structure”—that is, a package of data that tells another device what and how to show the results.
Let’s break down how it works in simple steps:
Step 1: Getting the Data and User Preferences
First, the system gets a stream of data that changes over time. This could be stock prices, weather numbers, or any other time-based data. At the same time, it gets the user’s choices. The user can pick what kind of analysis they want, what indicators to use, and what rules to apply. For example, they might say, “Show me when the momentum goes above a certain value,” or “Alert me if both the momentum and the trend are positive.”
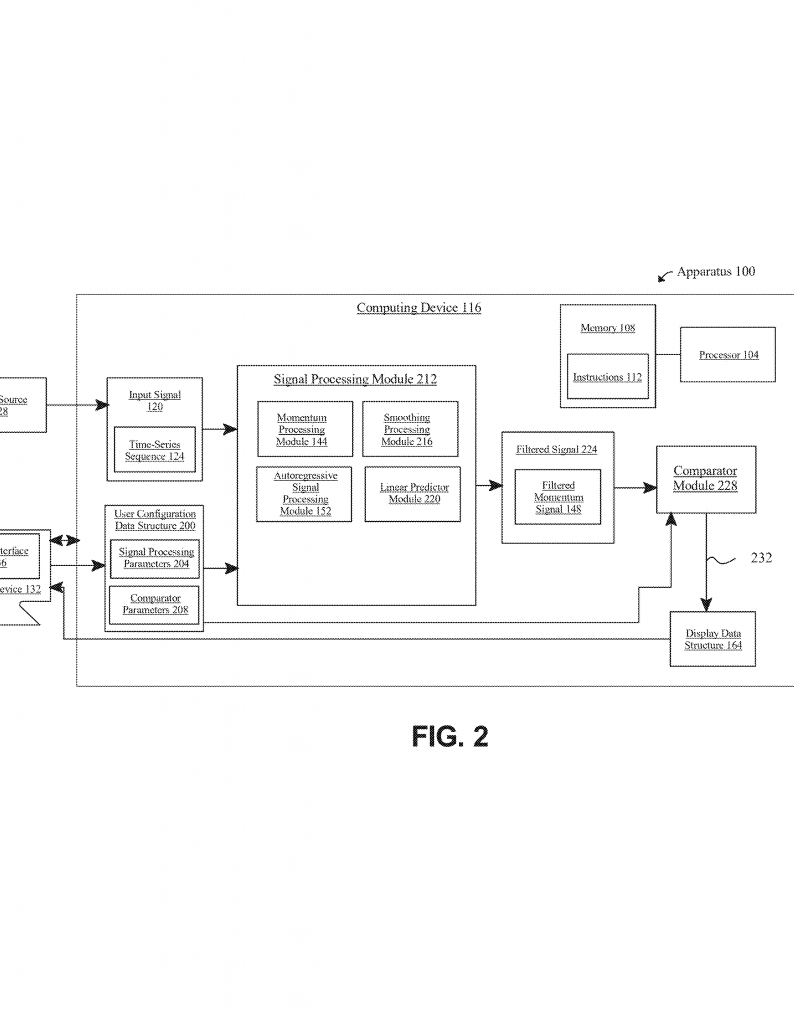
Step 2: Building a Custom Signal Processing Chain
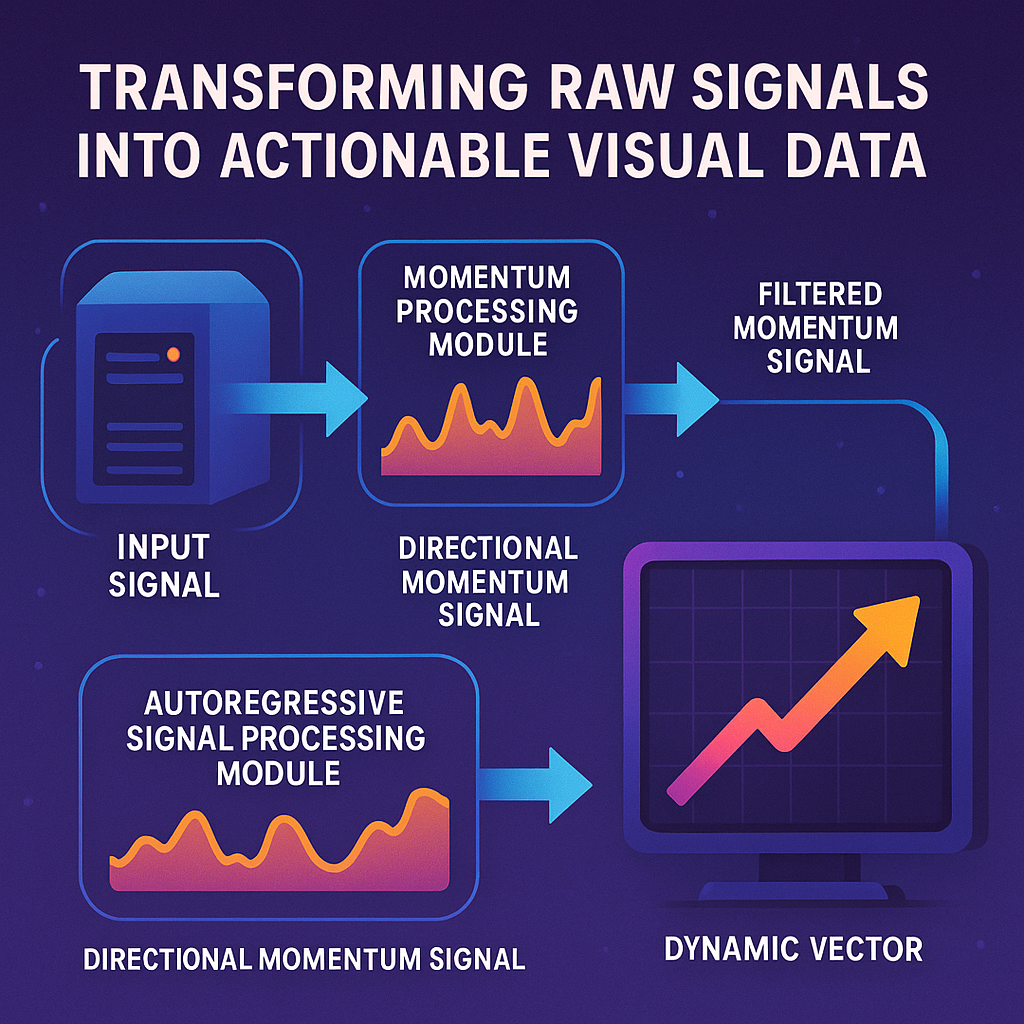
The heart of the system is a signal processing module. But this isn’t just one filter—it’s a collection of building blocks. The system looks at the user’s choices and picks which blocks to use and in what order.
For example, the user might want to see both momentum and trends. The system can apply a momentum filter first (to see how quickly values are changing), then an autoregressive filter (to smooth out the noise and find longer-term patterns). Each of these filters can be tuned: the user might pick how many days to use for the average, or how “sensitive” the filter should be.
If the user wants, two or more smoothing filters can be used, each with a different time window. For example, a short-term filter for quick changes and a long-term filter for bigger trends.
Step 3: Applying Logical Rules
After the data is filtered, the system applies a comparator module. This is where the user’s rules come in. The comparator can use boolean logic—for example, “AND” (both must be true), “OR” (either can be true), or “NOT” (must not be true). The rules can be set up using an easy interface, like dropdown menus or rows of choices.
Each rule checks the processed data. For example, “Is the momentum positive?” or “Is the value above the moving average?” The system can check many rules at once and then decide what to do based on which rules are true.
The user can also set up portfolios or groups of choices. For instance, “If all my buy signals are true, switch to a more aggressive investment plan.”
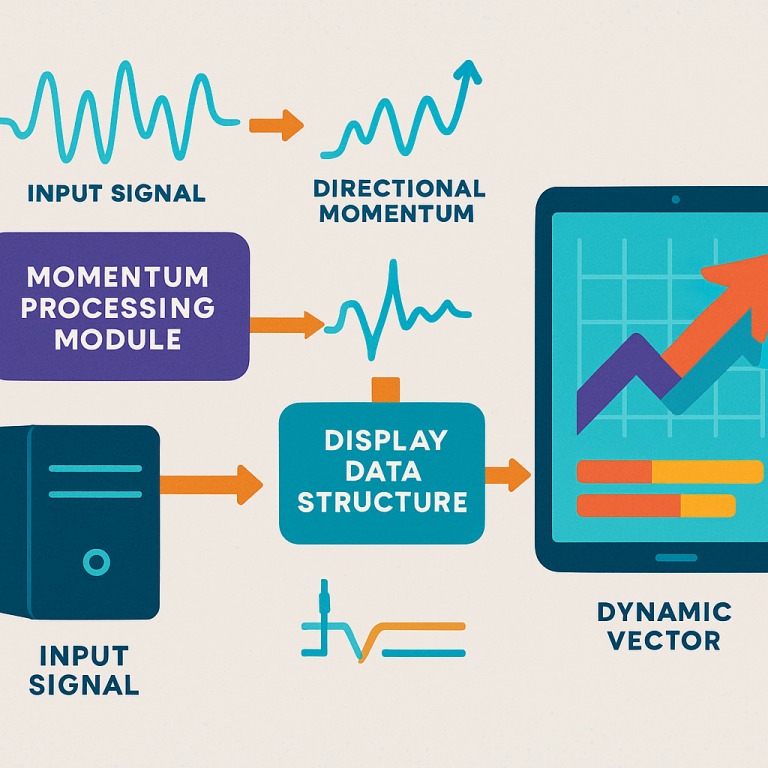
Step 4: Building the Display Data Structure
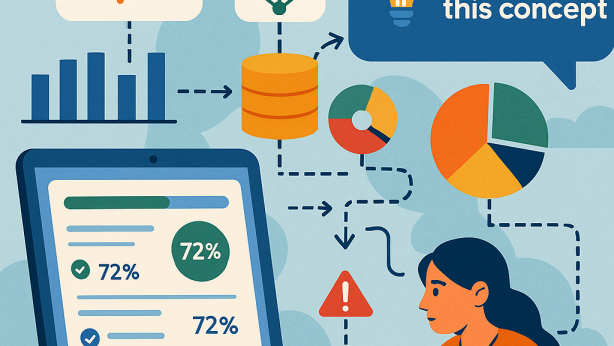
Once the rules are checked, the system creates a display data structure. This is a special package of information that tells another device—like a phone or computer—what to show. It can include graphs, dials, colored indicators, or even suggestions for what action to take.
The display can include:
- A gauge that points to “positive,” “neutral,” or “negative” based on the data.
- Graphs that show the data over time, with lines for important thresholds.
- Color coding, so users can see at a glance if things are good (green), bad (red), or in-between (yellow).
- Interactive elements, like buttons to refresh the data or see more detail.
- Time elements, such as “how many days has the signal been positive?”
The display can update in real-time or as often as the user wants. Event handlers make the display react to user actions or changes in data.
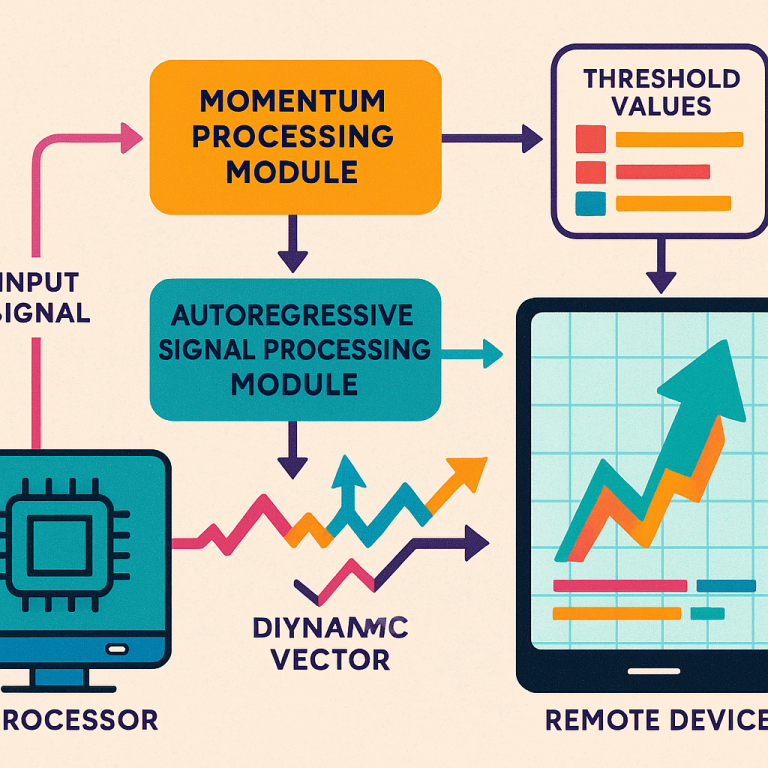
Step 5: Sending Results Anywhere
The final step is sending the display data structure to any remote device. This means users can check their dashboard on their phone, tablet, or computer, anywhere they are. The system is built to work with many types of devices and data sources.
Key Innovations
What makes this invention stand out? First, it lets users build their own analysis pipelines without needing to code. You can pick and mix filters and rules using simple menus. Second, it handles nonstationary data—data that changes its own patterns—by combining momentum and autoregressive filters, and by letting users set different smoothing periods.
Third, it uses smart logic for combining many signals. You’re not stuck with one rule; you can combine as many as you want and decide what happens when each group of rules is true. Fourth, it builds display packages that are flexible, interactive, and easy to send to any device. The system can show not just charts, but also gauges, colors, and interactive buttons.
Fifth, it can use machine learning to fine-tune filters and improve suggestions over time. It can learn from user feedback and real results, making the analysis smarter the more it’s used.
Finally, everything is built to be modular and scalable. You can add new types of filters, new ways to display results, or link to new types of data without rebuilding the whole system.
Conclusion
This patent brings together years of work in data analysis, user experience, and modern computing. It makes it easy for anyone to take messy, fast-changing data, process it with advanced math, apply their own rules, and see the results on any device in a clear, useful way. For businesses, investors, or anyone who needs to track time-based data, this invention offers power, flexibility, and simplicity all in one.
If you want smarter, faster, and more user-friendly ways to handle your data, this invention points to the future.
Click here https://ppubs.uspto.gov/pubwebapp/ and search 20250217089.