SYSTEM AND METHODS FOR SEISMIC VELOCITY IDENTIFICATION USING GRAPHS
Invented by ALFURAIDAN; Monther Rashed, AL-SHUHAIL; Abdullatif Abdulrahman, MAHMOUD; Sherif Mohamed Hanafy, SARUMI; Ibrahim Olatunji, KING FAHD UNIVERSITY OF PETROLEUM AND MINERALS
Seismic exploration helps us see what’s deep under the ground, but figuring out how fast sound moves through these layers has always been tricky. Now, a new system uses a simple idea from graph theory to get more accurate results with less effort. Let’s break down how this new invention changes the game, and why it matters for finding oil, gas, water, and other hidden treasures beneath our feet.
Background and Market Context
Imagine you’re standing on a field, wondering what lies far below. Maybe there’s oil, water, or just rock. To find out, experts use seismic surveys. They make a loud sound at the surface, like a hammer strike or a special machine, and place receivers across the ground to listen for echoes as the sound travels down and bounces off different underground layers. By listening closely, they can guess what’s down there based on how fast and how strong the sound comes back.
This process is vital in many industries. Oil and gas companies use it to locate new reserves. Water management teams use it to find aquifers. Construction companies use it to avoid surprises before drilling or building. Even environmental agencies use it to map out what’s underground to make sure it’s safe.
The key to all of this is knowing the speed of the seismic waves in each underground layer. Each type of rock, soil, or water has its own speed. Once you know the speed, you can match it to known materials and make a good guess about what’s there. That’s why getting accurate velocity readings is so important. If you get it wrong, you might miss a valuable oil deposit or drill into something dangerous.
Old methods have their limits. They can be slow, need lots of computer power, or sometimes give answers that are a little off. Companies and researchers have been searching for a way to make these surveys faster, cheaper, and more accurate. This is where the new system comes in, promising to make seismic surveys smarter using math tricks from graph theory.
Scientific Rationale and Prior Art
Before this new approach, seismic velocity was often figured out by stacking lots of data, lining up wave arrivals, and using heavy-duty math on big matrices. Some used Laplacian operators, Hermitian matrices, or cost functions that took lots of time and computer strength. Others tried using weighted graphs, but usually relied on the biggest eigenvalue, which sometimes led to errors. Each method had its own set of problems.
For example, one common method involved building a Hermitian matrix and finding its eigenvalues. This approach can be accurate, but it’s slow and eats up computing resources. Another method used cost functions and wave equations, but these also needed lots of calculations and sometimes gave results that were hard to trust. Some tried using weighted graphs and looked for the highest eigenvalue, but this didn’t always match the real world and could be off by quite a bit.
All these older methods shared a few problems:
They often required lots of steps and big computers. They could be slow, meaning results took a long time to get. Sometimes, they just weren’t accurate enough, especially when it came to tricky underground structures with more than one layer. The need for a better, faster, and more reliable way was clear.
A recent idea was to use graph theory. In this idea, the paths the seismic wave takes are turned into a graph, where each point is a vertex and each path is an edge. The weights on the edges are the distances the wave travels. By looking at the eigenvalues of certain matrices built from this graph, it’s possible to get information about the underground layers. But even here, most people used the biggest eigenvalue, which didn’t always give the right answer and sometimes made big mistakes.
The new invention builds on this graph theory idea but flips it in a clever way. Instead of the biggest eigenvalue, it uses the second largest. Testing shows this tiny change makes a huge difference. It’s much more accurate, and the math needed is simpler and quicker. This means survey teams can get better answers, faster, and with less effort, even in tough spots with many layers underground.
Invention Description and Key Innovations
Let’s walk through how this new system works, step by step, in a way that’s easy to picture.
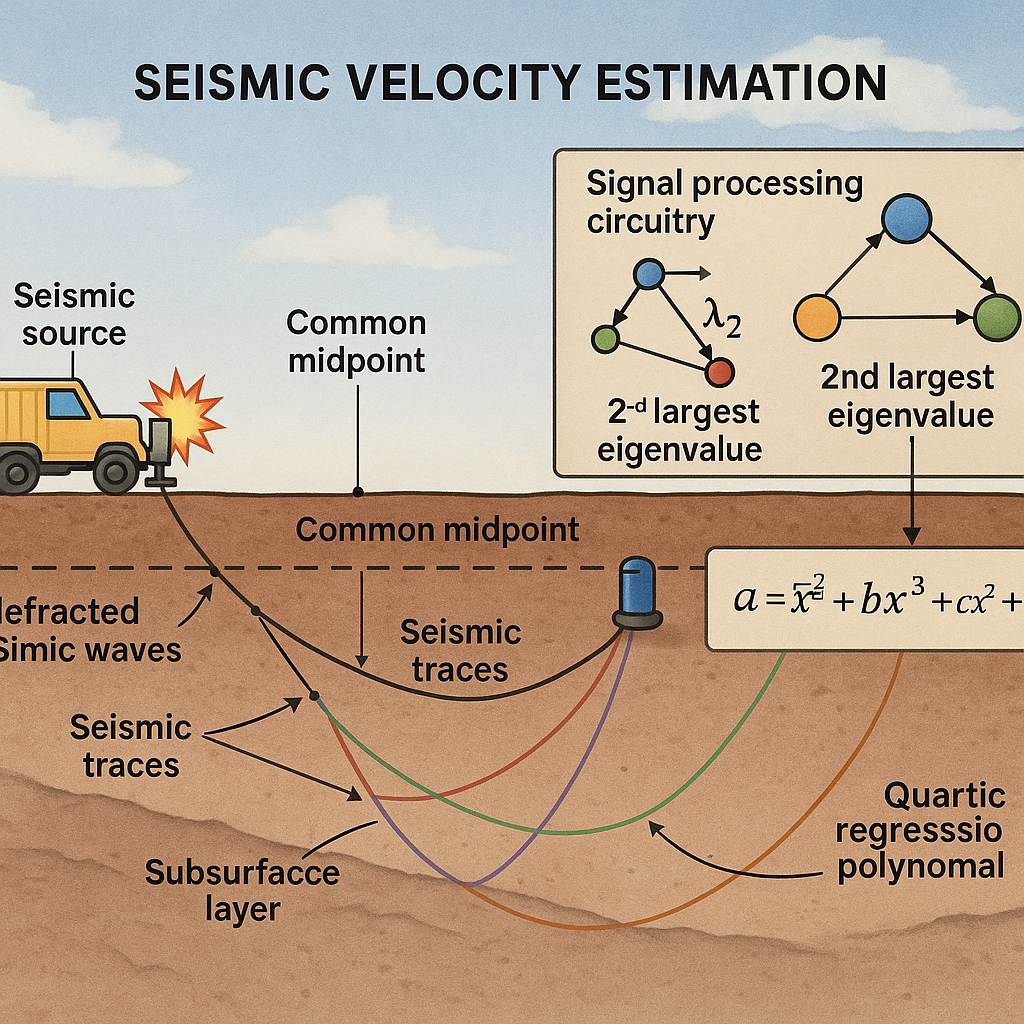
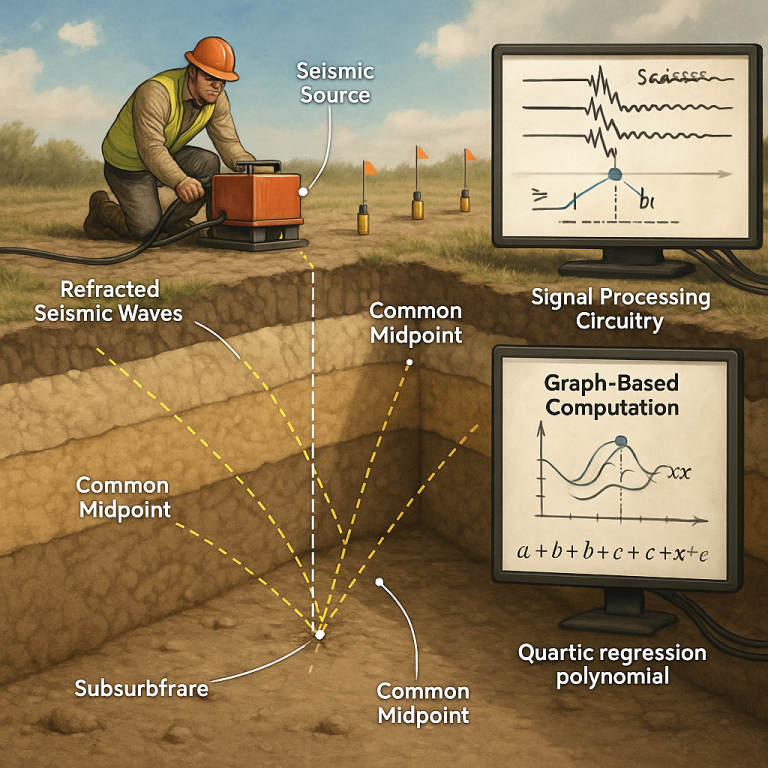
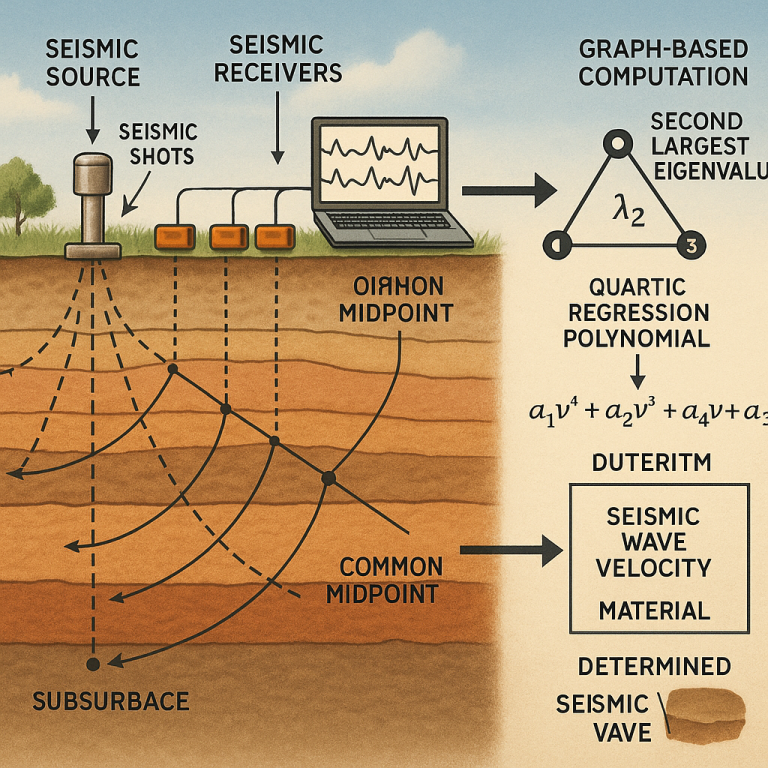
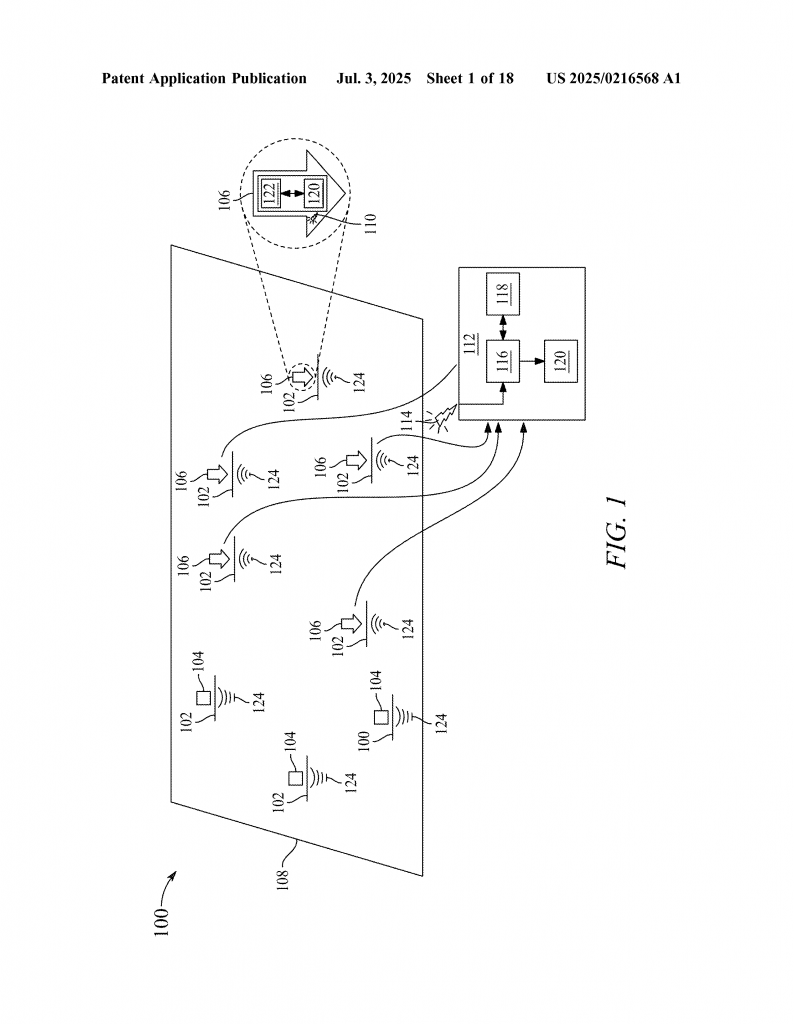
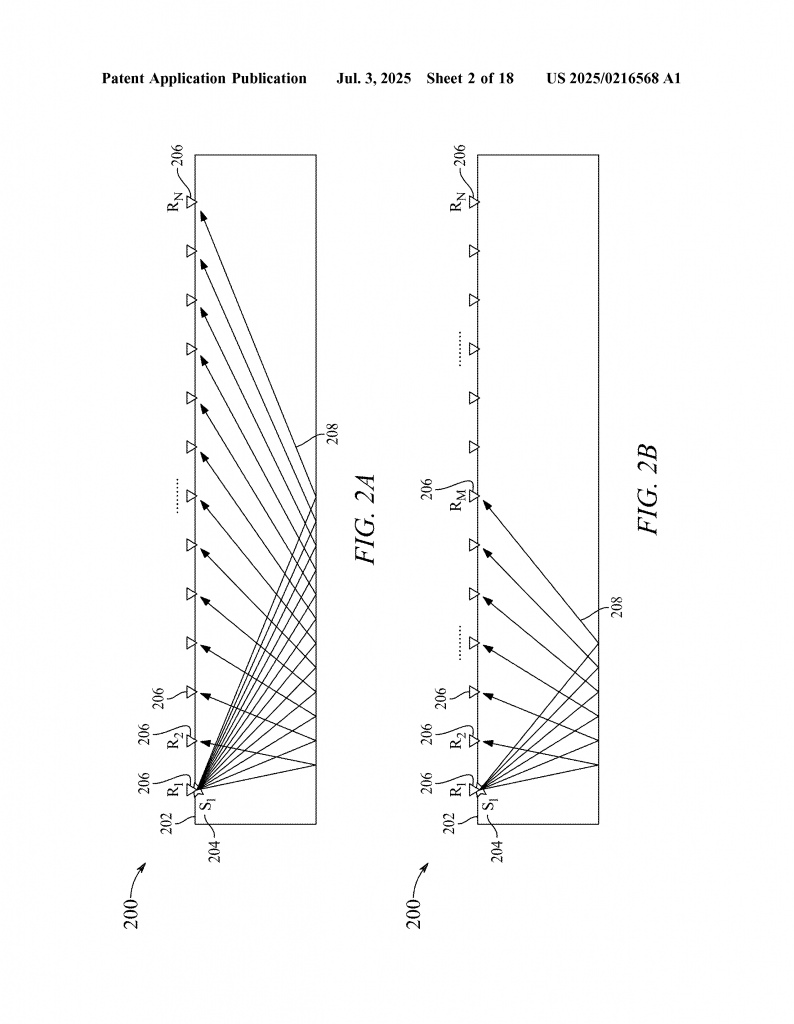
First, you set up a seismic source on the ground. This can be a hammer, a machine, or anything that can make a strong vibration. Next, you place several receivers (like geophones) at set distances. When the source makes a sound, the waves travel down and bounce off the layers below, then come back up. Each receiver picks up these returning waves, which are called seismic traces.
Each receiver has a transmitter that sends the collected data wirelessly to a computer unit. This computer gathers all the traces and stacks them, looking for patterns. One key pattern is the “common midpoint,” which is the spot exactly halfway between where the sound started and where it was picked up. Traces that share a common midpoint are grouped together for analysis.
Now, here’s where the magic happens. The system uses graph theory to model all the possible paths the waves could have taken, including how they refracted and reflected between layers. Each path is a ray, and every path between important points—like the source, receivers, and special points inside the layers—is mapped out as a vertex and edge in a graph. The length of each path is the weight on the edge.
For each set of three chosen traces, the system builds all possible source-receiver combinations. It forms a weighted adjacency matrix (a table of all the path weights), then a weighted degree matrix (summing up weights at each vertex). Using these, it creates a special matrix called the normalized weighted Laplacian. This matrix captures the structure of the graph and how all the paths connect.
Next, the system finds all the eigenvalues of this Laplacian matrix. Instead of picking the biggest one (like older methods), it finds the second largest by absolute value. This small but clever switch makes the estimation much more reliable, as shown by side-by-side tests.
The next step is to use this second largest eigenvalue as the main input to a quartic regression polynomial. This is just a fancy phrase for a math equation with powers up to four, like this:
V² = β₀ + β₁x + β₂x² + β₃x³ + β₄x⁴
Here, V is the velocity we want to find, x is the second largest eigenvalue, and the β’s are coefficients learned from test data. The system has already been trained using lots of synthetic data, so it knows the best β values to use.
By plugging the second eigenvalue into the equation, the system gets a velocity estimate for the second subsurface layer. It repeats this for all possible paths and chooses the velocity with the lowest error, making sure the answer is as close as possible to reality.
Finally, the system matches the found velocity to a database of known material velocities. If the speed matches what’s known for, say, sandstone or shale, the system tells you the likely material in that layer. It can even make a map showing what’s under the whole survey area, with both the velocity and the guessed material at each spot.
What’s really special about this invention is how it makes the whole process faster, simpler, and more accurate. There’s less computer work, so you can use smaller devices or get results in the field. The accuracy is much higher—up to ten times better in some tests—so the risk of missing valuable resources or making a costly mistake drops sharply. And because the method is simple to automate, it’s easy to use in all sorts of settings, from oil fields to city construction sites.
In numbers, the error in old methods could be as high as 4%. With this new method, the error drops to less than 0.3%, and sometimes as low as 0.01% in tests. That’s a huge improvement when millions of dollars are on the line.
The hardware needed is also straightforward. The receivers can be geophones or hydrophones, and the computer can be a laptop, a cloud server, or even a strong tablet. Data is sent wirelessly, making setup flexible, and the software does most of the work. The system can show results on a screen or even send them straight to a mapping tool.
The big picture is this: by using a smarter math trick from graph theory and focusing on the second largest eigenvalue, this invention makes subsurface exploration faster, cheaper, and much more accurate, no matter what you’re searching for underground.
Conclusion
Finding out what’s hidden deep below the earth has always been a challenge. This new system, built around a simple but powerful idea from graph theory, helps solve this problem in a way that’s smarter and more reliable than ever before. By listening to seismic waves and using the second largest eigenvalue from a special matrix, we can now get a much clearer picture of what’s under our feet. This means better decisions, less wasted money, and safer projects, whether you’re drilling for oil, searching for water, or just making sure it’s safe to build. The future of subsurface exploration is here, and it’s simpler than you might think.
Click here https://ppubs.uspto.gov/pubwebapp/ and search 20250216568.