Streamlining Cloud Failure Analysis: Smart Log Condensation Boosts AI Diagnostics Efficiency
Invented by KHOLODKOV; Dmitry Valentinovich
Modern software runs on very big, very complex systems. These systems are always busy. They run millions of tasks every day. Every task can make huge files called log files. These files remember everything that happens. When things go wrong, these files help us figure out the problem. But these log files are often so big that even the best computer tools struggle to read them. This is where a new way of handling log files comes in—a method that uses something called a “directional knowledge graph.” In this article, we will explain why this new approach matters, how it works, and what makes it different from older methods.
Background and Market Context
In today’s world, companies use computers for almost everything. Cloud servers, apps, and websites all depend on computers that talk to each other. These computers handle jobs like building new software, fixing old programs, and making sure everything works for people using their services. Every time someone builds new software or updates old code, the system creates a log file. This file keeps track of what happened—good and bad.
A log file is like a diary for computers. It tells us what happened, when it happened, and if anything went wrong. For example, if a software test passes, it writes that down. If a test fails, it writes that too. For big companies, there can be millions of these logs every day. Each log file can be huge, sometimes with millions of words. This is good for tracking everything, but it also creates a problem. If something breaks, engineers need to look at these logs to find out what went wrong. But with so much data, this is very slow and hard, even for smart computers.
Companies want to fix problems faster. They need tools that can look at these big log files and tell them what went wrong. Artificial Intelligence (AI) models, especially large language models (LLMs) like ChatGPT, are very good at reading and understanding text. But even these models have trouble with really large files. Most AI models can only look at a certain size of text at one time. If the log file is too big, the AI can’t read it all at once.
The common solution is to split the log file into smaller pieces, hoping the AI can make sense of each part. But this is not perfect. Breaking up the log file can cause important information to get lost or mixed up. Sometimes, the part that explains the problem is in one chunk while the part that caused it is in another. This makes it hard for the AI—or a human—to connect the dots. As a result, finding the real cause of a failure can take a lot of time, and sometimes it is not even possible.
Because of these problems, companies need a better way to handle log files. They want something that makes the logs smaller, but keeps all the important parts so the AI can still find what went wrong. This is where the new idea of using a “directional knowledge graph” comes in. It gives us a new way to shrink the log file without losing the details that matter.
Scientific Rationale and Prior Art
Before this new method, engineers tried several ways to deal with big log files. One of the most common ways was to break the file into smaller pieces, sometimes called “chunking.” The idea was simple: if the AI can’t read the whole file, maybe it can read parts of it and then put the answers together. But this often fails, because the AI does not always know how the parts connect. Some information gets lost if the split happens in the wrong place.
Other methods used older types of AI called recurrent neural networks (RNNs) or long short-term memory networks (LSTMs). These models can handle some sequence data, but they are not as good as the newer large language models. They also struggle with very long files and can forget earlier parts of the file as they read more.
Large language models (LLMs) like ChatGPT use a different method called “self-attention.” This lets them look at the whole input and find connections between words, even if the words are far apart. But LLMs still have a limit on how much text they can read at once. If the log file is too big, you are still stuck.
Some companies tried to pick out only the important parts of the log file. For example, they might only look at the lines where something went wrong, and throw away the lines where everything was okay. This helps, but it is still hard to know which lines are important without reading the whole file first.
Another idea was to use “knowledge graphs.” A knowledge graph is a way to show how different things are connected. In a knowledge graph, each point (called a vertex) stands for something, like a word or event. Lines (called edges) show how these things are related. Regular knowledge graphs are used in search engines, social networks, and many other places.
But using knowledge graphs for log files is not common. Most tools that use knowledge graphs are designed for general information, not for shrinking and analyzing big computer log files. Also, these graphs are usually not “directional.” That means they don’t show which way the connection goes (for example, “A causes B” is different from “B causes A”). In log files, direction matters a lot, because one event often leads to another.
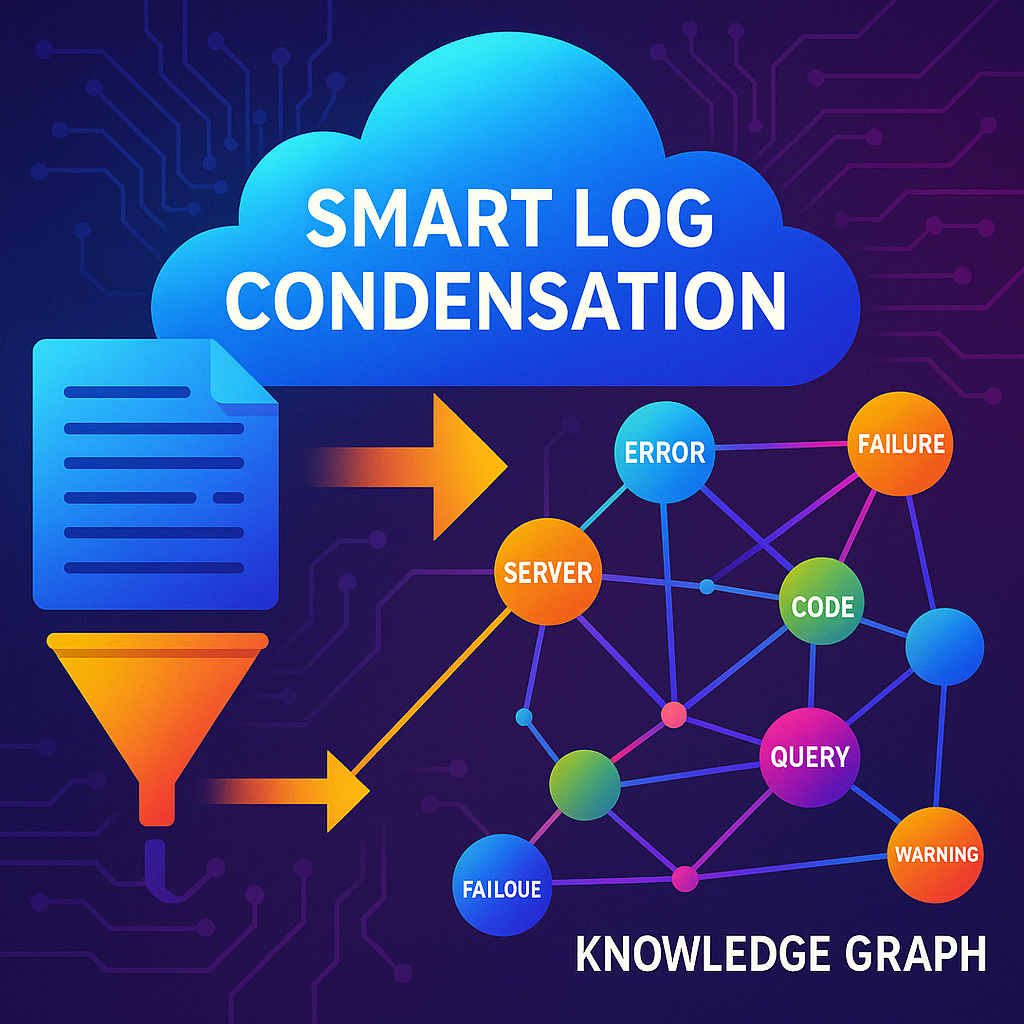
The new method builds on these ideas. It uses a “directional knowledge graph” to show how the important parts of the log file are connected, and which way the information flows. This way, the AI can see not just which parts are related, but also how one thing leads to another. The graph can be made much smaller than the original log file, but still keeps all the key details. This solves the problem of big log files and lets the AI work much faster and better.
Invention Description and Key Innovations
The new method changes the way we handle log files from very big, hard-to-read text files into small, smart graphs that are easy for both people and AI to understand. Let’s look at how this works and what makes it special.
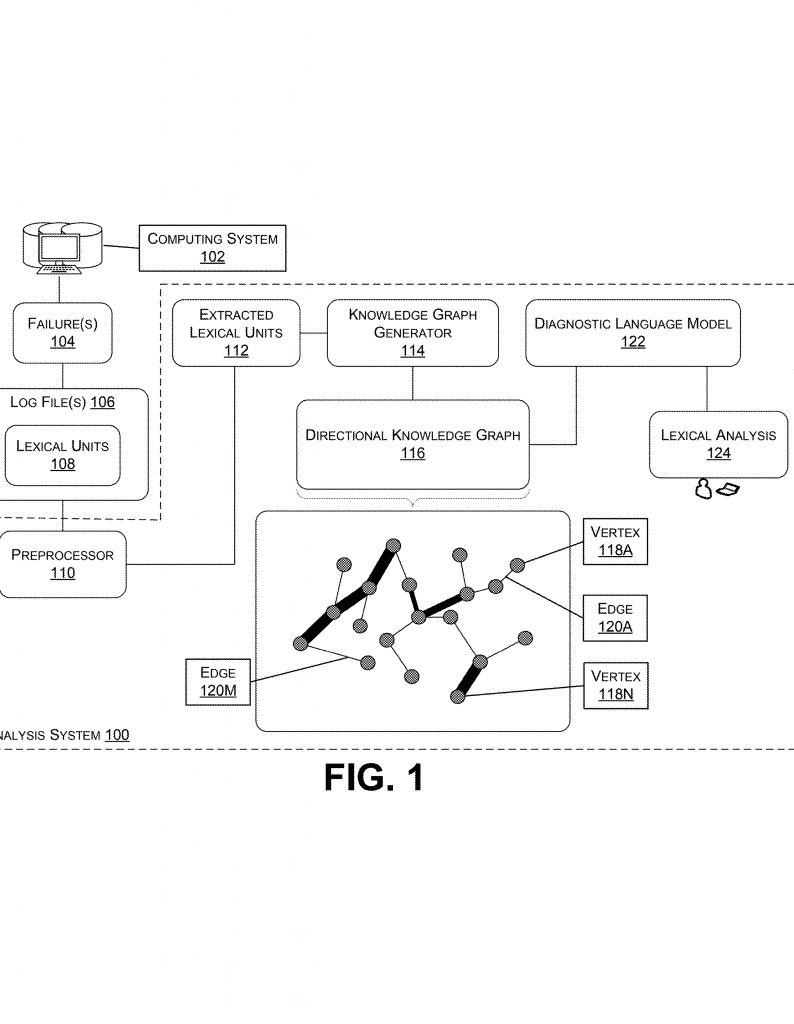
First, the system gets the log file from wherever it’s stored. This could be a cloud server, a build machine, or any place where computers keep their logs. The log file is just a big text file, full of lines that say what happened, when, and whether it was good or bad.
The next step is preprocessing. This means the system reads through the log file and finds the parts that matter most. Usually, it throws away all the lines where things worked fine. For example, if a test passed, that’s not interesting when you’re looking for why something broke. The system keeps the lines that show a failure, a warning, or an error. It also removes things like punctuation marks or spaces, which don’t help with finding the problem.
After this, you have a much smaller set of words, called lexical units. Each lexical unit is usually a word or number that means something in the log. For example, “error,” “timeout,” or “user123.” The system then creates a directional knowledge graph. In this graph:
– Each point (vertex) stands for a unique word or unit from the smaller set.
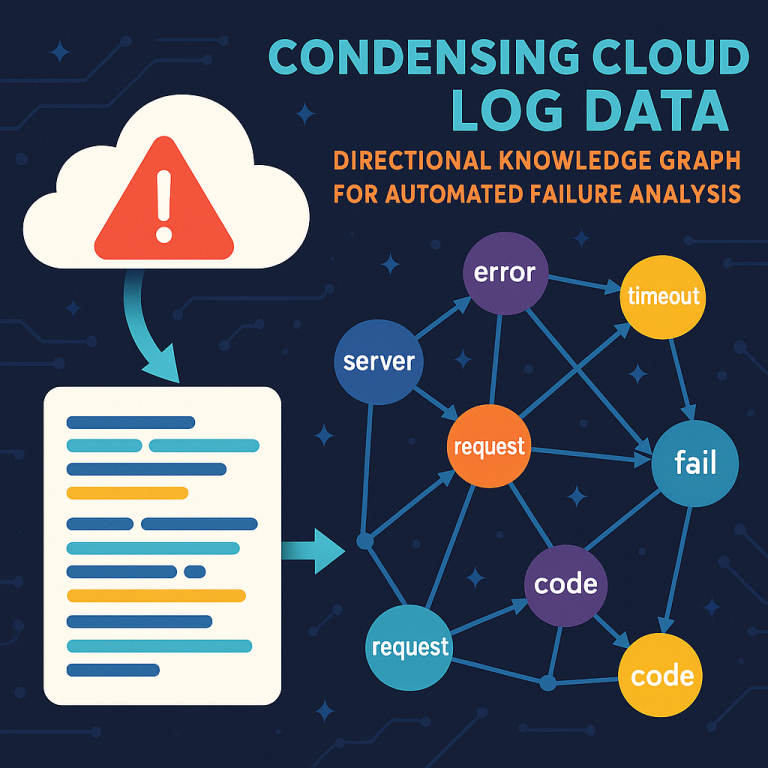
– Each line (edge) shows how two points are connected. The edge is directional, which means it points from one word to another, showing the flow or cause-and-effect.
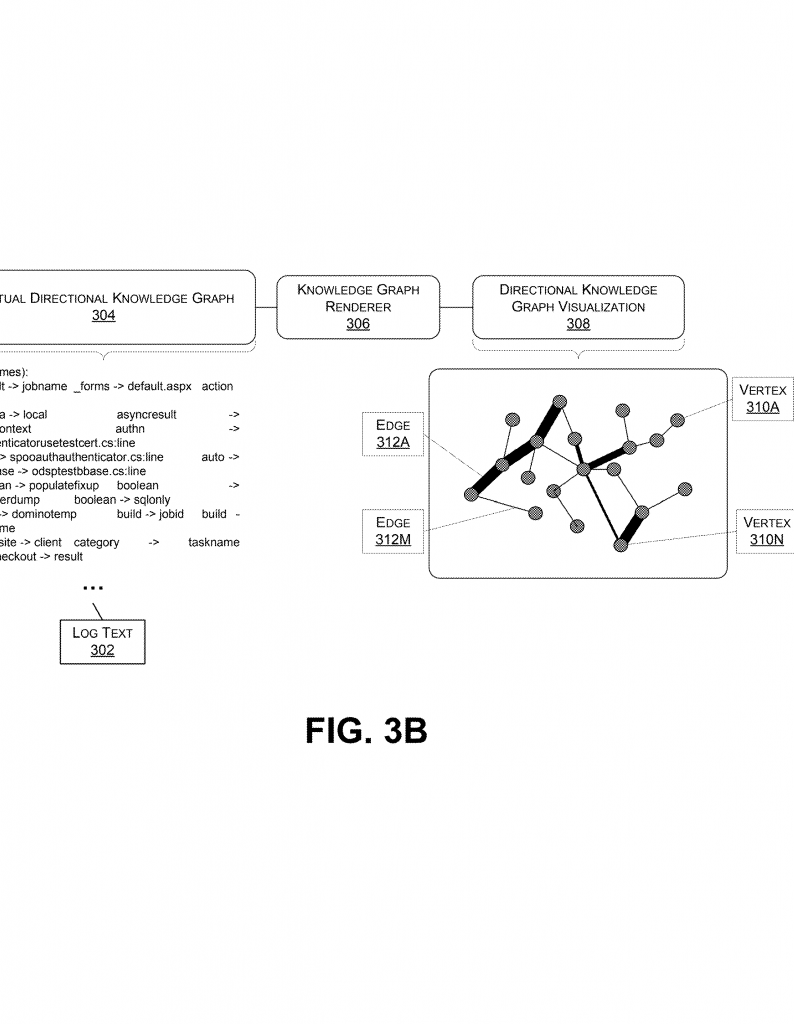
This graph is like a map of how the important parts of the log connect. If the word “timeout” often comes right after “database,” the graph will show a strong arrow from “database” to “timeout.” The thickness of the line can show how often this happens—the more it happens, the thicker the line.
Now, instead of giving the AI the huge log file, you give it this much smaller, smarter graph. The AI, which can be a large language model, reads the graph and tries to find patterns. It can see which words or events are most important, which ones are connected, and which ones often come before a failure.
The system can also show the graph in different ways. It can give the AI the graph as a simple text list, like lines saying “database -> timeout [15 times].” Or it can draw the graph as a picture and give that to the AI. Sometimes, the system can use both, depending on what works best with the AI model.
A cool part of this invention is that if the AI has seen a similar graph before, it can use what it learned last time. For example, if the same pattern of “database” leading to “timeout” happened last week, and it figured out the problem then, it can apply that answer again. This saves time and helps fix things faster.
The graph can also keep improving over time. As the system sees more and more log files, it learns which patterns keep coming back. This helps it get even better at finding problems in new log files.
The key innovations here are:
– Shrinking huge log files into small, easy-to-read graphs that keep all the important connections.
– Using direction in the graph to show how one event leads to another.
– Making the graph in a way that large language models can read and understand very quickly.
– Letting the system use pictures or text, whichever works better for the AI.
– Allowing the AI to use what it learned from old graphs to solve new problems faster.
This method works for all kinds of systems, from cloud servers to apps, and can help any company that needs to find and fix problems quickly. It saves time, uses less computer power, and makes it much easier to understand what went wrong.
Conclusion
Big log files are a huge challenge for modern companies. Old methods like splitting the file or using older AI models are slow and can lose important details. The new way—using a directional knowledge graph—shrinks the log file to only what matters, keeps the connections clear, and lets AI models find problems faster. This approach makes it possible to handle even the largest, most complex logs, all while saving time and resources. As more companies rely on AI for troubleshooting, this method will help them keep their systems running smoothly and fix issues before they become big problems. If you want to make your log analysis smarter and faster, this new invention is the way forward.
Click here https://ppubs.uspto.gov/pubwebapp/ and search 20250362995.