Automated Debug Tool Streamlines Error Resolution in Enterprise Data Clusters, Reducing Downtime

Invented by Santangelo; Dominick J., Tiwary; Vishal, Shilane; Philip
Debugging problems in big computer systems is hard. When lots of computers work together in a group, called a cluster, finding out why something went wrong can take a lot of time. Today, we will talk about a new way to make finding and fixing these problems easier and faster. This new way uses smart tools to look at special files called “core files” to help the people who built the system (the vendor) help you, the user, solve issues quickly. Let’s dive in and see how this new invention works and why it matters.
Background and Market Context
Let’s start with why this matters. Many companies today use lots of computers that work together as one big system. This is called a cluster system. Each computer in the cluster is called a node. These computers share files and run many small parts of big programs, called containerized applications. These systems are huge, often with hundreds or thousands of computers, and are used to store, back up, and process important data.
Because everything is connected, a problem in one node can quickly affect the whole system. When something goes wrong, it’s very important to find out what happened and fix it fast. If a company can’t access its data, it might lose money, customers, or even trust.
Usually, the people who own and use the cluster system are not the same people who built it. The builders (we call them vendors) have the know-how to fix deep problems. But to help, they need to see what was happening in your system when the trouble started. This information is often sent in what’s called a support bundle — a package of logs, stats, and other details about your system.
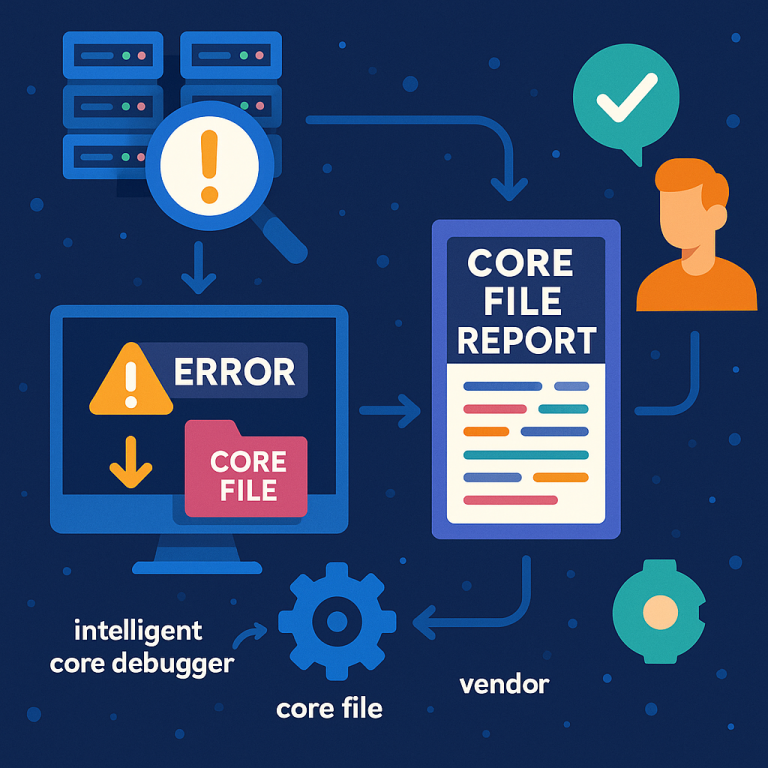
A key part of this support bundle is something called a core file. A core file is a snapshot of what the computer’s memory looked like when something crashed. It tells the story of what the programs were doing right before the problem. But here’s the catch: core files are very big, often many gigabytes. Sending them over the internet to the vendor can take a long time, especially if your company has slow connections or if there are lots of these files to send.
This is a big problem. The longer it takes to send information, the longer it takes to get help. If it takes hours or days to send files, your business might suffer. What’s needed is a way to help vendors understand and fix problems without always needing to transfer those big files.
The invention we’re discussing today solves this problem. It lets your system check and analyze core files right where they are, and then send just a short report to the vendor, not the whole giant file. This saves time, saves space, and gets you help faster.
Scientific Rationale and Prior Art
Now let’s talk about how things worked before, and what makes this new idea different.
In the past, when a node in a cluster crashed, the system would save a core file. If you needed help, you would send the whole file to the vendor. The vendor would load it into special programs (like debuggers) to see what was happening at the moment of the crash. They would look at what functions were called, what data was in memory, and try to spot what went wrong.
But, as computers get bigger and run more programs at once, core files keep getting larger. Sometimes they can be over 50 or even 100 gigabytes. Moving these files around is slow and eats up precious internet bandwidth. If you have many nodes, the problem gets even worse — you might have to send lots of big files every time something goes wrong.
Some older tools tried to help by creating “support bundles,” which are collections of logs and related files. But these bundles were often still too big and not focused on just the important parts a vendor needs. They also didn’t work well with containerized applications (where apps are split into small, separate parts running in “containers”), or with modern ways of running clusters, like Kubernetes.
Previous debugging tools often required you to use many different programs or interfaces. This made it hard to get a complete picture. Sometimes, they didn’t gather all the important data from every node, or they weren’t smart about which files to send.
What was missing was a way to:
- Quickly check if a core file is really important for debugging.
- Analyze the core file right on the node, without moving it first.
- Decide what to send to the vendor — just the useful summary, not the whole file.
- Work smoothly with containerized applications and modern cluster setups.
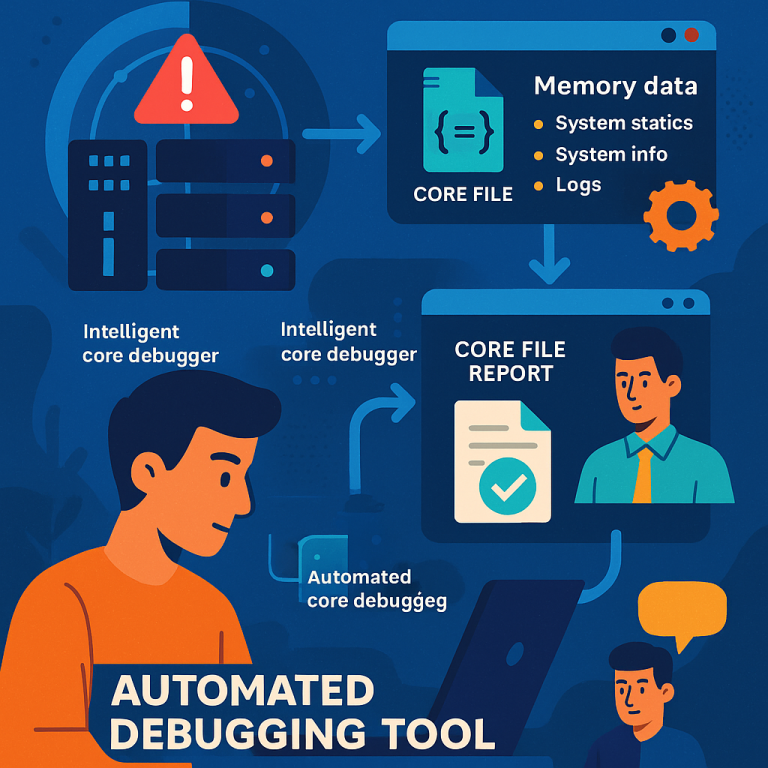
This invention brings all of these together. It uses a smart tool called an intelligent core debugger (ICD) that runs on your system. This tool can look at new core files, decide if they’re relevant, check if the system has enough resources to analyze them, pull out the important facts, and send just a short, focused report. Only if more detail is needed does the vendor ask for the big file.
The ICD is different from past tools because it is automatic, selective, and works with containers. It saves time, keeps your network free, and makes help arrive faster.
Invention Description and Key Innovations
Let’s look at how this new invention actually works, step by step, and what makes it special.

Suppose you have a cluster system running many containerized applications. One day, something goes wrong on one of the nodes. Here’s what happens:
1. Core File Generation
When a fault or crash happens, the node’s operating system creates a core file. This file captures everything in the computer’s memory at that moment — what the programs were doing, what data they had, and more.
2. Detecting and Verifying the Core File
The ICD tool on the node notices that a new core file appeared. But before it does anything, it checks a set of rules:
- Is this core file related to the recent fault?
- Is it a type of core file that should be analyzed?
- Has this file already been analyzed?
- Is it newer than other reports?
This helps the system ignore files that don’t matter, or files that have already been checked.
3. Check the Debugging Environment
Analyzing a core file can use a lot of memory and processing power. The ICD checks if the node has enough free resources to do the job. For example, it makes sure there is enough memory to decompress the file, and enough CPU power to run the analysis, without harming other important tasks.
The ICD also checks that the right tools are present — like the original program that crashed, and its libraries. This is needed because debugging a core file only makes sense if you have the exact software that made it.
4. Extracting the Core File Report
If everything checks out, the ICD decompresses the core file (if needed), and runs special analysis tools. One common tool is GDB, which can show the backtrace — a list of function calls leading up to the crash for each thread. This backtrace is like a roadmap showing what the program was doing, step by step, when the problem happened.

The ICD pulls out these backtraces, variables, and other key facts, and puts them into a core file report. This report is much, much smaller than the full core file. It still gives the vendor what they need to get started on finding the root cause.
5. Sending the Report to the Vendor
Once the report is ready, the ICD sends it to the vendor using telemetry (a way of sending small pieces of important data securely and quickly). The vendor looks at the report and tries to figure out the problem.
– If the report has enough info, the vendor sends back advice or a fix.
– If more info is needed, the vendor can ask for the full core file or more details.
This process saves time and network bandwidth, and means fixes can happen sooner.
Special Features and Innovations
Here’s what makes this approach stand out:
– Automatic and Smart Selection: The ICD does not analyze every core file, only those that matter. It uses rules to pick the right files and skips old or unimportant ones.
– Resource Awareness: The ICD checks if the node can handle the analysis without running out of memory or slowing down other work. This prevents system slowdowns.
– Works with Containers: The system is built for modern containerized applications and Kubernetes setups. Each container or pod can have its own logs and core files, and the ICD can handle this complexity.
– Compression and Storage Management: Core files are stored in compressed form to save space. Old files are deleted regularly so the system never runs out of room.
– Cron Jobs and Automation: The ICD is often linked with a “cron job” — a scheduled task that wakes up every so often (like every 5 minutes) to check for new files. This means users don’t have to do anything manually; the system keeps itself tidy and ready.
– Scalability: In big clusters, each node can analyze its own core files. This spreads out the work and keeps the central network from getting overloaded.
– Flexible Reports: The vendor can adjust what is included in the reports if they need different details for new problems.
– Privacy and Security: Only the summarized report is sent, not the whole memory dump, unless absolutely needed. This helps protect sensitive data.
Putting It All Together
This invention isn’t just a single tool — it’s a new way of thinking about debugging in large, modern computer systems. It brings together automation, smart selection, resource checks, and container-awareness to make support easier and quicker.
It’s also flexible: it works for any size of cluster, with any number of nodes, and for many different types of applications. It can be used in on-premises data centers or in the cloud, wherever clusters are used.
When a problem happens, the system quickly creates a report, sends it to the vendor, and either gets a fix or, if needed, sends more data. This keeps your business running and reduces the pain of long waits for help.
Conclusion
Debugging in cluster systems has always been a tough job. With this new invention, users and vendors have a powerful, automatic way to handle system crashes and faults. The intelligent core debugger checks, analyzes, and reports on problems right where they happen, saving time and bandwidth. It only sends what’s needed, and only when needed, making support faster, smarter, and more secure.
If you run large, modern computer systems, this approach means less downtime, quicker fixes, and a better experience for everyone. It’s a step forward in keeping your important data and applications running smoothly, no matter how complex your system gets.
Click here https://ppubs.uspto.gov/pubwebapp/ and search 20250335285.