SORTABLE HEAT MAP
Invented by CRUSE; Bradley H., HOWELL; Zachary, KLEIN; Uri, JP Morgan Chase Bank, N.A.
Today, we are going to explore an innovative patent application about sorting heat maps in a new, interactive way. If you have ever looked at a heat map and wished you could move things around to see patterns more clearly, this invention is for you. Let’s break down why this matters, how it fits into the world of data, and what makes it special.
Background and Market Context
To start, let’s talk about heat maps and why they are so useful. A heat map is a colorful chart that shows high and low values in a big set of data. Instead of looking at lists of numbers, you see colors that make it easier to spot trends and outliers. Imagine you are a teacher who wants to see how students are doing in different subjects, or a banker looking at interest rates across cities. The heat map turns all those numbers into a picture, giving you a quick way to see what’s hot and what’s not.
But there’s a problem: most heat maps don’t let you change the order of things on the screen. They give you information, but you can’t easily sort it by what matters most to you. Maybe you want to see the rows with the highest values at the top, or you want to line up columns by which ones have the most red or green. Without this kind of sorting, you have to rely on your memory, or worse, write things down to keep track. As the amount of data grows, it gets harder and harder to spot important patterns by eye alone.
Businesses, schools, banks, and even scientists use heat maps to make decisions. If you can sort a heat map right on your screen, you can find answers faster. This is especially helpful when you are dealing with a lot of information, like hundreds of rows and columns. Interactive sorting makes the heat map more than just a picture – it becomes a tool you can use to explore, focus, and understand your data.
With more organizations relying on data to guide choices, there is a growing need for tools that make big data sets easy to manage. This patent application aims to solve that problem by letting users sort heat maps by any row or column, in any order they choose. It makes data analysis more hands-on, saving time and helping people make better decisions.
Scientific Rationale and Prior Art
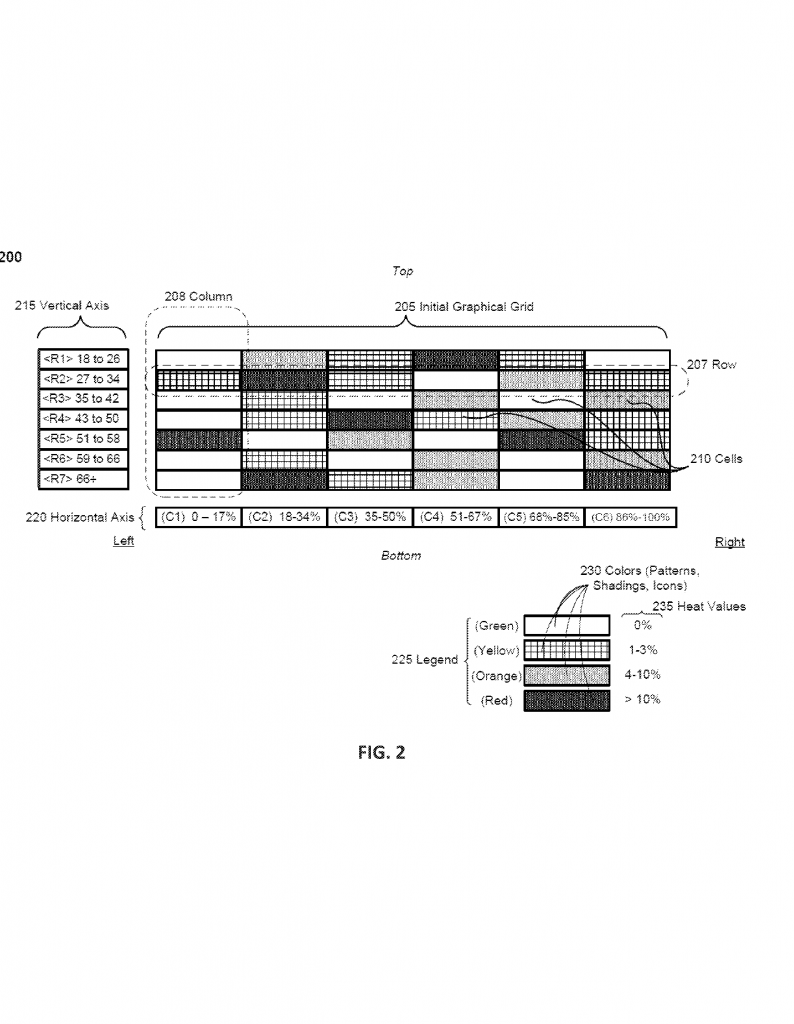
The science behind heat maps is simple: you take two groups of things, put one on the vertical side, one on the horizontal side, and fill the boxes in between with colors that show how strong or weak something is. It’s like a game of battleship, but instead of ships, you have colors showing scores, rates, or levels. Each color stands for a range of values. For example, green might mean low, yellow medium, orange high, and red very high.
In the past, heat maps were mostly static. You could change the data, and the colors would update, but the order of rows and columns stayed the same. Some systems let you filter out certain values or zoom in, but changing the order of the rows or columns to highlight patterns was not common.
There are some old ways to make sense of heat maps, like printing them out and drawing on them, or copying the data into a spreadsheet and sorting it there. But these methods are slow and break the connection between the picture and the data. Some software tools let you sort tables or lists, but heat map sorting is more complex because you need to keep the color patterns lined up with the right labels.
At the technical level, sorting a heat map means taking one row or column, putting its values in order, and then moving the rest of the map to match. This way, the colors in other rows or columns also move around, so patterns become clearer. It’s not just about moving numbers – it’s about moving the whole visual picture in sync with the data.
Previous inventions focused on updating heat maps as new data came in or letting users filter out unwanted data. Some let you sort a single row or column, but they didn’t re-order the rest of the map, so you couldn’t see the big picture change. That’s why this new idea stands out: it connects sorting to the entire map, letting you reorganize the whole chart based on what matters to you.
Invention Description and Key Innovations
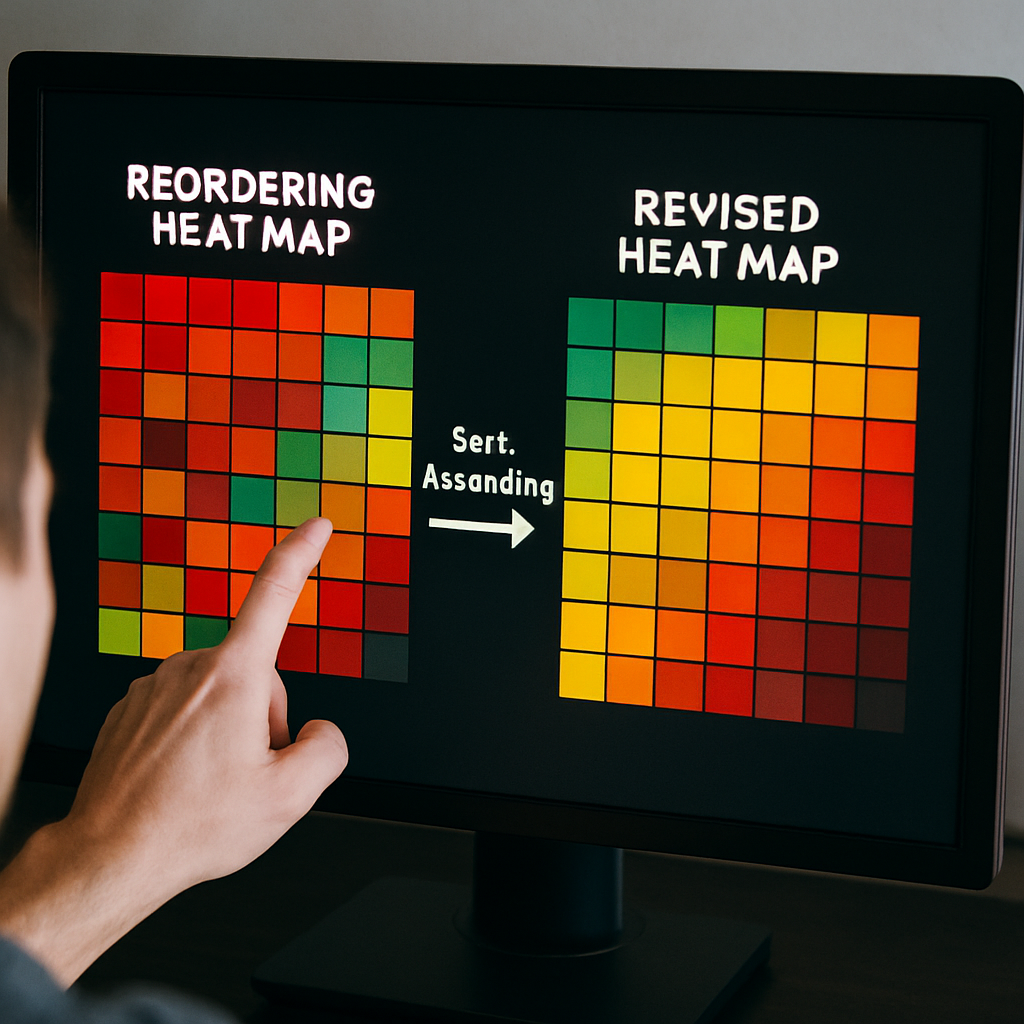
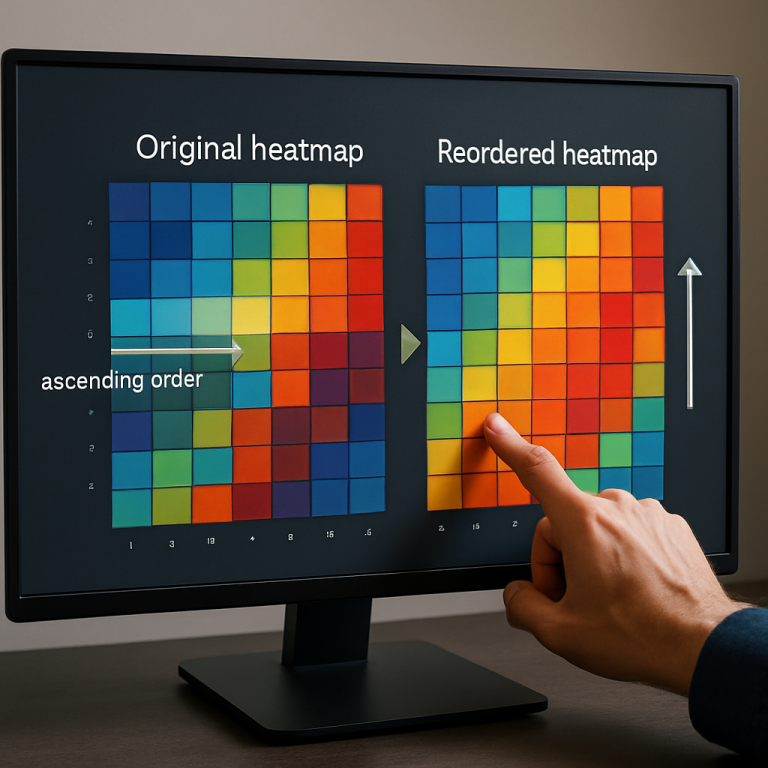
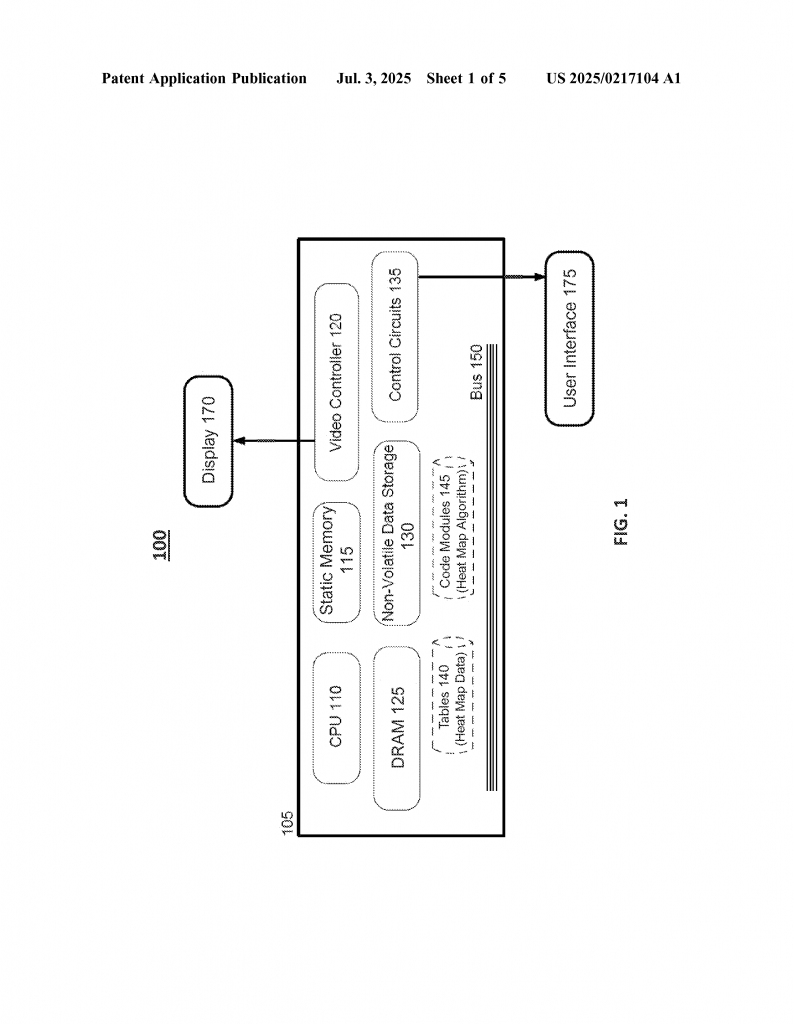
Now let’s dive into what this patent application brings to the table. The invention is a way to let users interact with a heat map on a computer. You can pick any row or column, sort it by its values (either from lowest to highest or highest to lowest), and the whole map updates to match your choice. This is done using a computer processor, a display, and special software instructions.
Here’s how it works, step by step:
First, the computer shows a heat map on the screen. This map has two sides – a vertical axis and a horizontal axis. Each side stands for a group of things, like different cities or types of customers. Each box in the map, called a cell, shows a color or icon that stands for a value, like a sales number or score.
Next, you can choose any row or column you like. Maybe you want to look at the column for “New York” or the row for “2023.” You use your mouse or finger to pick the one you want. The system then asks if you want to sort it from low to high or high to low.
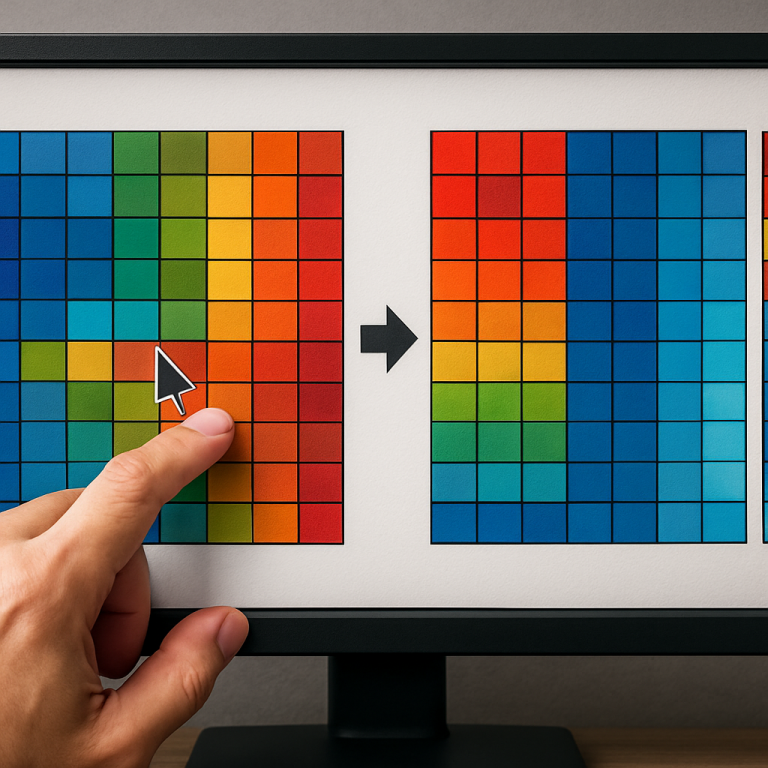
Once you choose, the computer sorts the values in that row or column. It puts the smallest number first (or last, if you pick descending order) and lines up the rest in order. But it doesn’t stop there – it uses this new order to rearrange all the other rows or columns, so the whole map changes to match your sorting choice. Now, you can see all the data lined up by what’s important to you, and patterns that were hidden before can jump out.
The color, texture, or icon in each cell moves with its row or column. The labels on the sides update too, so you always know what you’re looking at. If you want, you can sort again by a different row or column, or switch from ascending to descending. All of this happens right on the screen, in real time, making it easy to try different views until you find the one that tells the story you need.
One smart part of this invention is how it lets you control the order of the colors or icons. Maybe you want red to mean “best” instead of “worst,” or you want to use shapes instead of colors. The system can be set up with a hard-coded order, a user-chosen order, or a legend that tells you what each color means. This makes the tool flexible for many different kinds of data.
The patent also covers how the computer keeps track of the mapping between the old order and the new one. When you sort, it remembers where each value started and where it moved, so the rest of the map can be updated correctly. This mapping is key to keeping everything lined up, so you don’t lose track of what each cell means.
There are other helpful features, too. You can use a sorting widget – a small pop-up or menu – to make your choices. This can be a drop-down menu, a button, or even a touch gesture. The system works on many devices, from desktop computers to tablets and phones. It can be built into other software or used as a stand-alone tool.
By turning a static heat map into an interactive, sortable display, this invention lets users explore large sets of data in a way that’s simple and fast. Instead of feeling lost in a sea of colors, you can focus on the relationships and patterns that matter most to you. This saves time, reduces mistakes, and helps people make better choices, whether they are teachers, business managers, or scientists.
Conclusion
This patent application sets a new standard for working with heat maps. By letting users sort any row or column and see the whole map update instantly, it turns a basic chart into a powerful tool for finding insights. The invention solves real problems faced by anyone who needs to make sense of big, complex data. With its simple, user-friendly design, it can be used in many fields, from finance to healthcare to education. As more organizations look for ways to turn data into action, innovations like this will play a key role in making data easy to understand and use.
Click here https://ppubs.uspto.gov/pubwebapp/ and search 20250217104.