DETERMINING CRITICAL LOGS FOR NETWORK APPLICATIONS
Invented by Gupta; Rahul, Shan; Alexander Zhang, Sridhar; Thayumanavan, Banka; Tarun, Yavatkar; Raj, Singh; Rahul
Troubleshooting network application issues is tough. With logs pouring in from every layer of a data center—application, compute, and network—it can feel like searching for a needle in a haystack. But what if a computer could sort, rank, and point out only the most important logs? Let’s explore a new patent application that promises to transform how we find root causes in complex cloud and network systems.
Background and Market Context
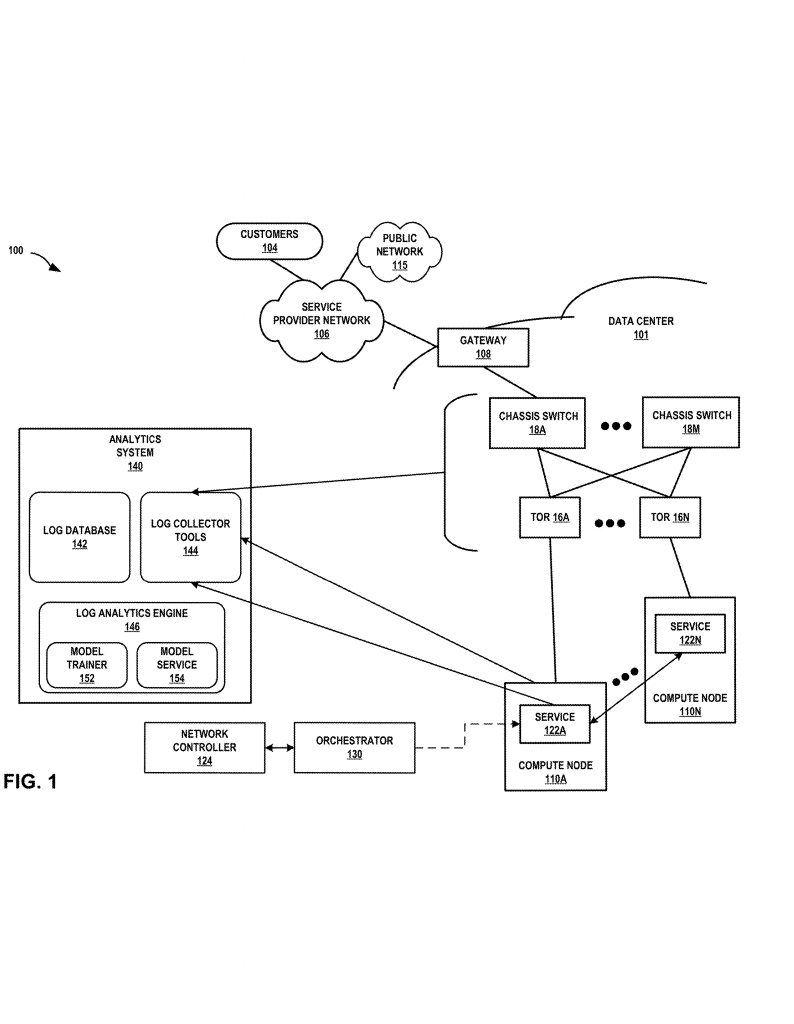
Modern businesses run on digital applications. These apps live in data centers—big rooms full of computers, storage, and network switches. Today’s data centers often use virtualization. This means that instead of running one application on one physical computer, many virtual computers (called “virtual machines” or “containers”) can run on the same physical hardware. This makes things more efficient and flexible.
But all this flexibility comes with a challenge: when something goes wrong—like an app slowing down or crashing—it’s hard to know why. Each layer (application, compute, network) keeps its own logs. Each log records events, errors, warnings, or normal operations happening in that layer. Together, these logs create a mountain of data. When a performance issue pops up, IT teams need to dig through all these logs to pinpoint the problem.
Going through every log from every layer takes time, smarts, and experience. Often, teams must involve experts from different backgrounds: app developers, server admins, and network engineers. Each group uses different tools and speaks a different “language” when reading logs. This slows down root cause analysis and can make outages last longer.
The market has seen a boom in log management tools and analytics platforms. Companies spend millions on software that collects, stores, and searches logs. Big players like Splunk, Elastic, Datadog, and others offer solutions to collect and search logs at scale. But even with these tools, figuring out which logs matter most during a performance crisis is usually a manual—and very tedious—task.
As digital transformation pushes even small businesses onto cloud and hybrid networks, the amount of log data keeps growing. At the same time, users expect faster fixes and less downtime. Speed, accuracy, and automation are now must-haves. The market is hungry for systems that not only collect and store logs, but also automatically highlight the “critical logs” that matter most when something breaks.
This new patent application addresses that hunger. It introduces a clever way to use machine learning and smart ranking to quickly surface the logs that are most likely to be connected to a problem. This approach promises to save time, reduce stress, and make troubleshooting much more precise.
Scientific Rationale and Prior Art
Before we dive into the new invention, let’s look at how things are usually done and why it’s so hard to find the root cause of network application issues.
Every system—whether it’s a web app, a database, or a network switch—writes logs. These logs can include errors, warnings, info messages, and debug details. In large, layered systems, logs come from many places:
– The application layer logs record what the app is doing, what requests are being served, and any errors users might see.
– The compute layer logs cover what’s happening on the servers: CPU usage, memory problems, software crashes, and more.
– The network layer logs show what’s happening with the switches, routers, and network interfaces: connection drops, packet loss, and so on.
When an app is slow or broken, the logs from all three layers might hold clues. But with so much data, finding the important logs is like looking for gold in a river full of rocks.
The usual ways to find root causes include:
– Manual log searching: IT teams use search tools and try different keywords to find logs that look suspicious.
– Pre-defined rules and alerts: Some systems let teams set up alerts for known problems, like “ERROR” messages or high CPU use.
– Correlation by time: Teams look for logs that happened right before or during a problem.
– AI and anomaly detection: Some tools use machine learning to flag logs or metrics that look unusual compared to normal patterns.
Each of these methods has limits. Manual searching is slow and error-prone. Rules and alerts only work for known problems and can generate too many false alarms. Correlation by time helps, but still leaves teams with too many logs to check. AI and anomaly detection are promising, but often treat logs from each layer separately and may not give clear connections between layers.
Prior research and products have tried to use templates to group similar logs together. For example, the Drain3 algorithm groups logs based on patterns, masking out variable data (like timestamps or user IDs) to create a template. Grouping logs makes it easier to see common events, but doesn’t automatically tell which templates are important during a new issue.
Some tools build knowledge graphs to map dependencies between services, servers, and network devices. These graphs can help teams understand which parts of the system are connected, so they can focus on the logs from relevant nodes. But again, using these graphs to automatically highlight critical logs is not widely solved.
In summary, existing methods can collect, group, and search logs, and some can flag anomalies. But none provide a smooth, automated way to:
– Gather logs from all layers,
– Map them to learned templates,
– Rank and pick the logs that matter most based on context and timing,
– And deliver a short list of “critical logs” for root cause analysis—without manual guesswork.
That’s where the invention in this new patent application stands out.
Invention Description and Key Innovations
The new patent application reveals a method and system for finding the most important logs—called “critical logs”—to help figure out why a network application is slow or broken. Let’s walk through how it works, step by step, in simple terms.
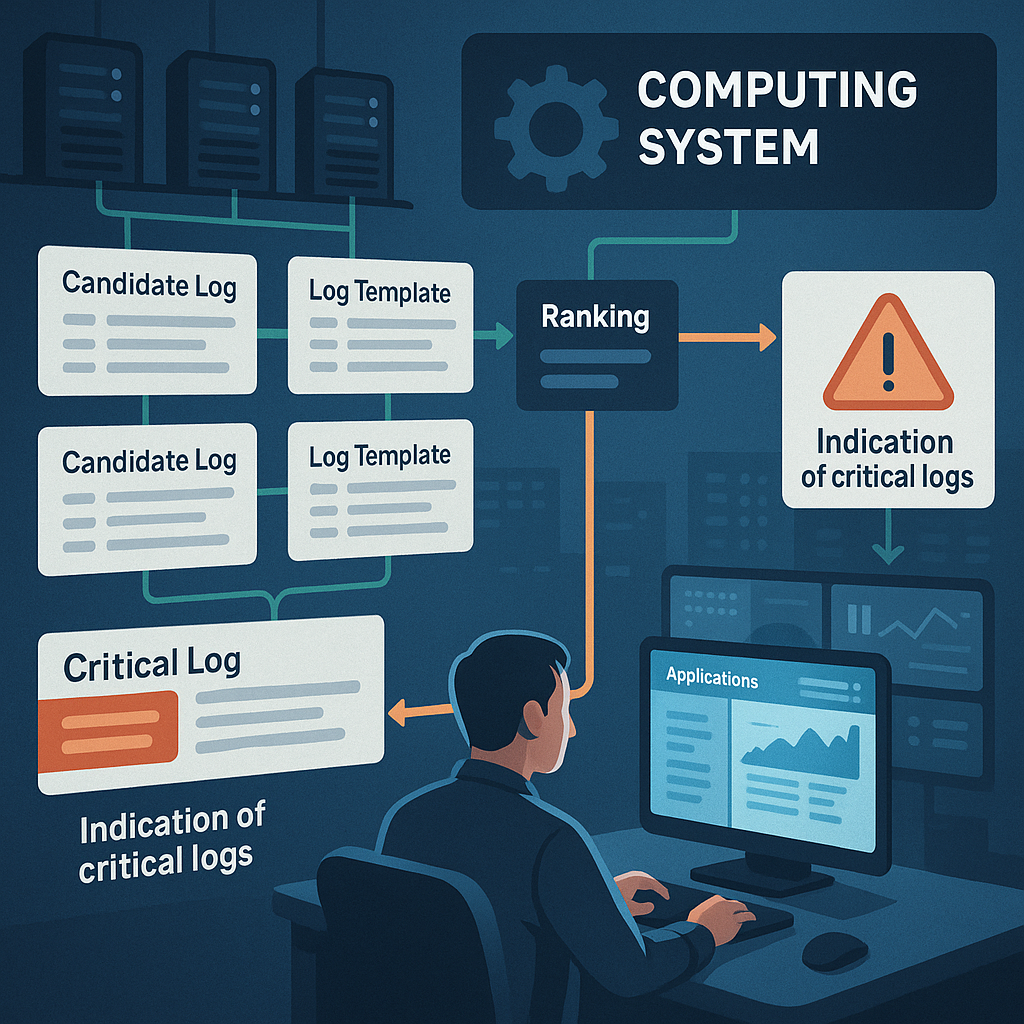
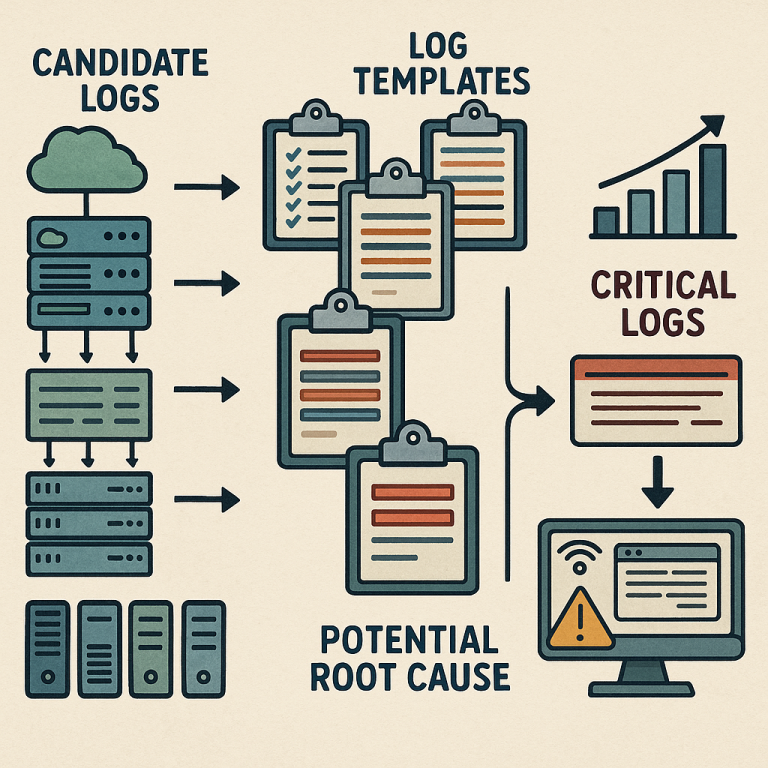
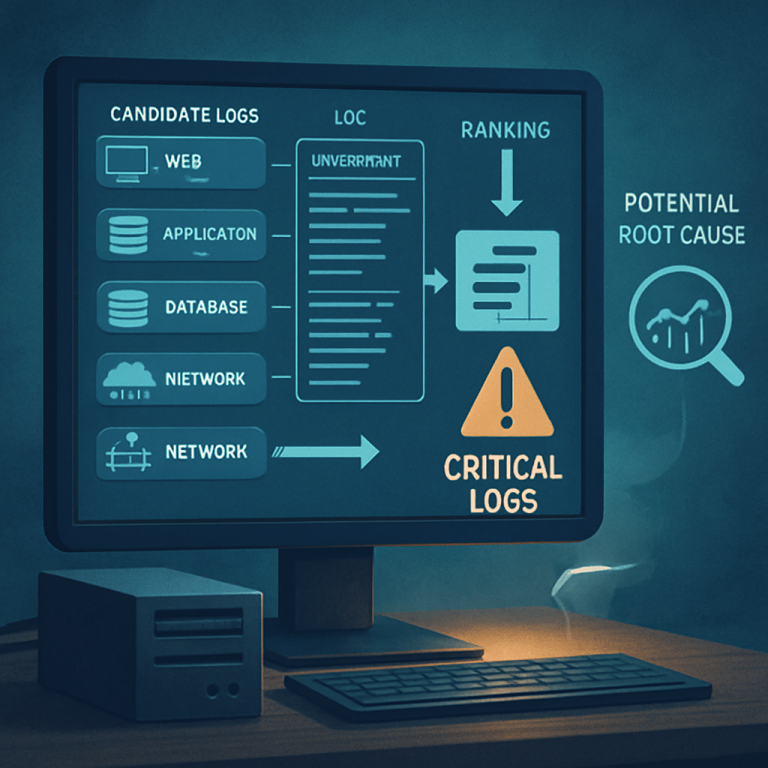
1. Collecting Logs from Every Layer
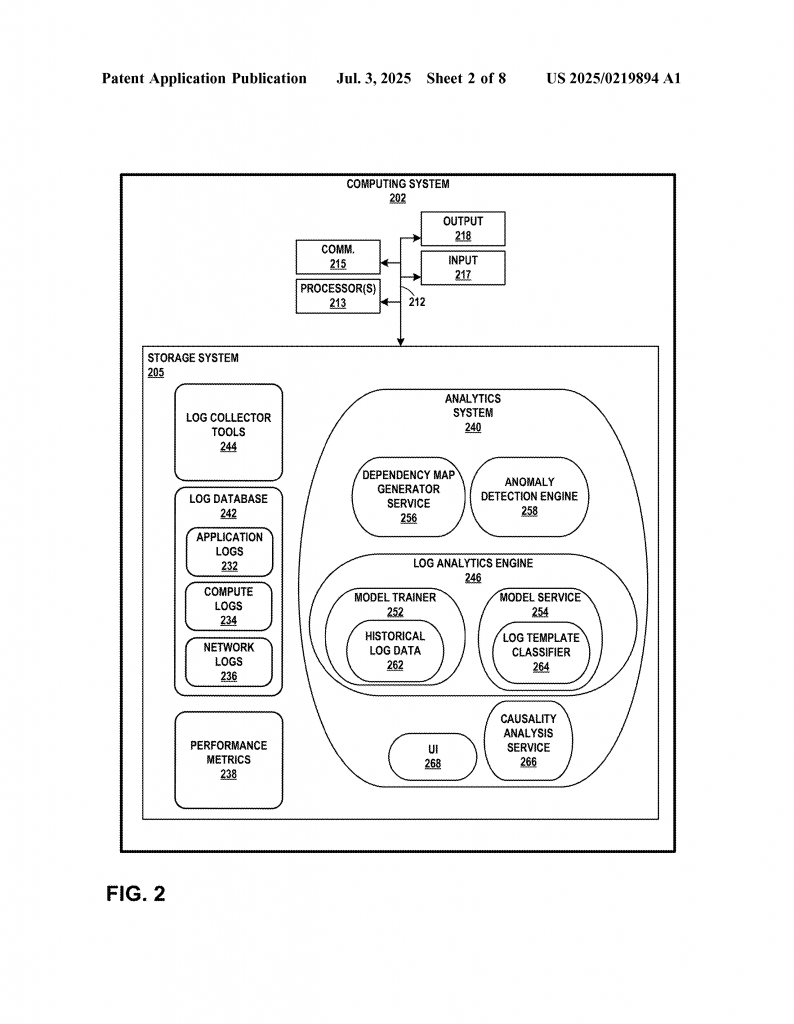
First, the system collects logs from all layers: application, compute, and network. These are called “candidate logs.” The logs can come from many sources—servers, switches, app containers, and more. The system can also use a “knowledge graph” to focus only on the nodes (like servers or switches) that are likely involved in the problem. This saves time and reduces the amount of data to look at.
2. Turning Raw Logs into Templates
Next, the system uses a smart machine learning model called a “template mining model.” This model has been trained on lots of historical logs to learn common patterns, or “templates.” For example, different logs about failed logins might have the same template but different user names or IP addresses.
The system maps each new candidate log to one of these templates, hiding the details that change (like user IDs) and keeping the parts that matter (like “ERROR: failed login”). This mapping turns a mountain of logs into a smaller group of templates, each with one or more log “instances” tied to it.
3. Ranking Templates by Importance
Here’s where the magic happens. The system looks at each template and checks a few things:
– Keywords: Does the template include words like “error,” “fail,” or “critical”?
– Frequency: Is this template rare (only happens sometimes), or common (shows up all the time)?
– Recognition: Has the machine learning model seen this pattern before, or is it new and unknown?
– Recentness: Did logs with this template happen close to the time of the performance issue?
Based on these factors, the system assigns each template a category and a “critical score.” Templates with important keywords, that are rare, that are new or unrecognized, or that happened just before the problem, get higher scores.
The system can use different methods to combine these factors. For example, it might give more weight to logs with critical keywords, or to those that are rare and recent. It can also penalize templates with keywords that aren’t helpful, like “INFO” or “GET.”
4. Picking the Critical Logs
After scoring and sorting, the system picks a handful of the highest-scoring templates. For each template, it selects the log instance with the timestamp closest to the time the problem was noticed. These log instances are the “critical logs”—the short list that IT teams should focus on to find the root cause.
The system can output these critical logs directly, or give an “indication” to another system that does deeper root cause analysis. It can also show them in a user interface, with visualizations to help make sense of the problem.
5. Learning and Adapting Over Time
The template mining model can keep learning as new logs come in. If the system sees new types of logs or new problems, it updates its templates and gets smarter. It can also retrain on new data to adapt to changes in the network or application.
This way, the system isn’t stuck with old patterns—it evolves with the network and the apps it monitors.
6. Working with Metrics and Anomaly Logs
The invention doesn’t just look at plain logs. It also works with “metrics”—numbers that show how things are performing, like CPU load, network latency, or app response time. If a metric looks strange or crosses a threshold, the system can create an “anomaly log” for it. These anomaly logs are treated just like any other logs: they get mapped to templates and considered for critical log selection.
By including metrics and anomalies, the system gives a full picture of what’s happening, not just what’s written in text logs.
7. Reducing Data and Saving Resources
One of the biggest benefits: by using templates and ranking, the system cuts down the number of logs teams need to look at. Instead of searching through thousands or millions of logs, teams get a short, focused list. This saves memory, processing time, and, most importantly, human time.
Because the system uses knowledge graphs and anomaly detection, it avoids wasting time on logs from parts of the system that aren’t involved in the problem.
8. Flexible Implementation
The invention can be delivered in many forms:
– As a method running on regular servers or in the cloud.
– As a special-purpose computing system with processors, storage, and communication units.
– As software instructions stored on readable media.
It can plug into existing log management systems, collect logs using standard tools, and integrate with other analytics and visualization platforms.
9. Real-World Example
Suppose an online shopping app is slow for users. The system:
– Notices a jump in response times (anomaly detected).
– Gathers logs from the “cart” service, the server it runs on, and the network switches it uses.
– Maps all these logs to templates, finding that a rare network error template and a new, unrecognized compute error template popped up right before the slowdown.
– Ranks these as critical logs and sends them to the IT team.
– The team quickly sees that a network switch had a configuration mismatch, causing packet drops—fixing the issue much faster than before.
Conclusion
This patent application introduces a smart, automated way to find the most important logs when network applications have issues. By using machine learning to create templates, ranking logs by importance, and focusing only on the parts of the system involved in a problem, it saves time and makes troubleshooting much more effective.
In a world where digital apps keep getting more complex, and where every second of downtime means lost revenue or unhappy users, this invention stands to make a real difference. It brings clarity to the chaos of logs and gives IT teams the tools they need to solve problems faster and smarter.
For businesses looking to stay ahead, adopting such automated critical log detection could be the key to keeping applications running smoothly and customers happy.
Click here https://ppubs.uspto.gov/pubwebapp/ and search 20250219894.